Royston (Iceni) Weather Station
Daily Weather Observations - February 2011
(All Times GMT)
| Date | Max. Temp. (°C) 09/09h | Min. Temp. (°C) 09/09h | Grass Min. Temp. (°C) 21/09h | Earth (30cms) Temp. (°C) 09h | Sun (Hours) 00/00h | R'fall (MM) 09/09h | Wind Dir'n 09h | Mean Wind Speed (MPH) 00/00h | Max. Gust Speed (MPH) 00/00h | Cloud Cover (Oktas) 09h | Mean MSL Air Pressure (mB) 00/00h | Mean Rel. Humd. (%) 00/00h | Mean Temp. (°C) 00/00h | Fog (vis. <1000m @ 09h) | Fog (vis. <200m @ 09h) | Snow or Rain and Snow 00/00h | Snow Lying @ 09h (>50% cover) | Hail 00/00h | Thunder 00/00h | Date |
| 1 | 6.5 | -2.9 | -5.1 | 3.1 | 0.6 | 0.1 | SW | 8.9 | 21 | 8 | 1024.0 | 92.3 | 3.0 | 0 | 0 | 0 | 0 | 0 | 0 | 1 |
| 2 | 10.1 | 1.5 | 0.0 | 3.4 | 2.6 | 0.1 | S | 12.3 | 34 | 7 | 1022.0 | 90.2 | 6.3 | 0 | 0 | 0 | 0 | 0 | 0 | 2 |
| 3 | 11.1 | 4.0 | 2.1 | 4.0 | 4.5 | 0.0 | SW | 11.8 | 41 | 7 | 1020.5 | 82.2 | 6.8 | 0 | 0 | 0 | 0 | 0 | 0 | 3 |
| 4 | 12.0 | 8.2 | 7.4 | 4.6 | 0.0 | TR | SW | 20.8 | 51 | 8 | 1012.2 | 80.0 | 11.0 | 0 | 0 | 0 | 0 | 0 | 0 | 4 |
| 5 | 12.9 | 11.0 | 10.4 | 5.7 | 0.0 | 0.1 | SW | 19.4 | 48 | 8 | 1014.0 | 80.3 | 11.9 | 0 | 0 | 0 | 0 | 0 | 0 | 5 |
| 6 | 12.5 | 10.4 | 10.0 | 6.5 | 1.6 | 0.0 | SW | 16.3 | 39 | 8 | 1016.8 | 79..0 | 11.0 | 0 | 0 | 0 | 0 | 0 | 0 | 6 |
| 7 | 12.0 | 8.1 | 6.9 | 6.9 | 1.9 | TR | SW | 14.5 | 43 | 8 | 1012.4 | 77.3 | 8.4 | 0 | 0 | 0 | 0 | 0 | 0 | 7 |
| 8 | 9.3 | 1.9 | -1.8 | 6.2 | 8.6 | 0.0 | W | 4.1 | 16 | 0 | 1021.1 | 83.0 | 4.4 | 0 | 0 | 0 | 0 | 0 | 0 | 8 |
| 9 | 10.8 | 3.1 | 0.5 | 5.5 | 4.2 | TR | S | 7.1 | 24 | 8 | 1016.2 | 88.1 | 7.2 | 0 | 0 | 0 | 0 | 0 | 0 | 9 |
| 10 | 10.0 | 6.7 | 5.1 | 5.9 | 0.0 | 5.1 | S | 6.8 | 24 | 8 | 1011.1 | 94.2 | 9.1 | 0 | 0 | 0 | 0 | 0 | 0 | 10 |
| 11 | 12.2 | 7.0 | 5.1 | 6.5 | 2.4 | 2.6 | S | 5.4 | 18 | 2 | 1009.7 | 94.0 | 9.5 | 0 | 0 | 0 | 0 | 0 | 0 | 11 |
| 12 | 11.0 | 8.3 | 6.4 | 6.9 | 2.9 | 0.1 | W | 6.1 | 19 | 8 | 1009.6 | 88.4 | 8.0 | 0 | 0 | 0 | 0 | 0 | 0 | 12 |
| 13 | 8.4 | 3.4 | 1.4 | 6.6 | 0.0 | 1.8 | S | 8.9 | 28 | 8 | 1000.8 | 91.3 | 6.3 | 0 | 0 | 0 | 0 | 0 | 0 | 13 |
| 14 | 9.5 | 3.4 | 1.9 | 6.5 | 7.5 | 0.4 | S | 6.8 | 27 | 1 | 999.9 | 85.5 | 5.4 | 0 | 0 | 0 | 0 | 0 | 0 | 14 |
| 15 | 7.1 | 1.9 | -1.9 | 5.9 | 1.1 | 0.8 | SE | 6.0 | 24 | 6 | 991.2 | 92.1 | 5.0 | 0 | 0 | 0 | 0 | 0 | 0 | 15 |
| 16 | 9.0 | 2.1 | 0.4 | 5.9 | 3.0 | 0.0 | S | 4.8 | 19 | 8 | 994.2 | 90.5 | 5.4 | 0 | 0 | 0 | 0 | 0 | 0 | 16 |
| 17 | 7.0 | 3.4 | 1.8 | 5.8 | 0.0 | 0.0 | E | 2.4 | 11 | 8 | 1004.8 | 93.0 | 5.2 | 1 | 0 | 0 | 0 | 0 | 0 | 17 |
| 18 | 5.4 | 2.8 | 2.7 | 6.0 | 0.0 | 4.7 | S | 4.5 | 21 | 8 | 1012.4 | 90.3 | 3.6 | 0 | 0 | 0 | 0 | 0 | 0 | 18 |
| 19 | 5.4 | 2.1 | 2.0 | 5.9 | 0.0 | 2.5 | E | 4.3 | 25 | 8 | 1010.0 | 94.9 | 4.1 | 0 | 0 | 0 | 0 | 0 | 0 | 19 |
| 20 | 4.0 | 3.0 | 3.0 | 5.9 | 0.0 | 0.1 | NE | 2.9 | 13 | 8 | 1014.8 | 96.4 | 3.4 | 1 | 0 | 0 | 0 | 0 | 0 | 20 |
| 21 | 4.7 | 2.4 | 2.0 | 5.7 | 0.0 | 0.5 | SE | 2.7 | 16 | 8 | 1013.1 | 92.5 | 3.7 | 0 | 0 | 0 | 0 | 0 | 0 | 21 |
| 22 | 6.8 | 3.3 | 2.5 | 5.6 | 0.0 | 2.3 | S | 4.3 | 15 | 8 | 1015.7 | 91.8 | 4.9 | 0 | 0 | 0 | 0 | 0 | 0 | 22 |
| 23 | 10.3 | 4.9 | 4.1 | 6.0 | 0.0 | 3.3 | S | 8.4 | 22 | 8 | 1015.0 | 94.7 | 7.5 | 0 | 0 | 0 | 0 | 0 | 0 | 23 |
| 24 | 13.9 | 7.9 | 6.1 | 6.5 | 6.6 | 0.0 | W | 7.1 | 18 | 7 | 1020.6 | 88.4 | 9.6 | 0 | 0 | 0 | 0 | 0 | 0 | 24 |
| 25 | 14.5 | 6.2 | 3.6 | 6.8 | 2.2 | 3.9 | S | 8.2 | 25 | 8 | 1021.8 | 88.9 | 10.6 | 0 | 0 | 0 | 0 | 0 | 0 | 25 |
| 26 | 8.6 | 7.5 | 7.0 | 7.5 | 0.5 | 1.7 | NW | 11.0 | 32 | 8 | 1012.1 | 89.8 | 8.0 | 0 | 0 | 0 | 0 | 0 | 0 | 26 |
| 27 | 9.0 | 1.8 | -0.5 | 7.0 | 5.6 | 0.7 | W | 6.5 | 24 | 1 | 1019.6 | 89.5 | 4.5 | 0 | 0 | 0 | 0 | 0 | 0 | 27 |
| 28 | 3.7 | 2.0 | -0.5 | 6.6 | 0.0 | 0.7 | N | 5.7 | 21 | 8 | 1029.3 | 93.0 | 3.1 | 0 | 0 | 0 | 0 | 0 | 0 | 28 |
| Total/Mean | 9.2 | 4.5 | 3.0 | 5.9 | 55.6 | 31.5 | X | 8.1 | X | 6.8 | 1013.0 | 89.0 | 6.7 | 0 | 0 | 0 | 0 | 0 | 0 | Total/Mean |
| *Diff./% | +1.8 | +2.5 | 77% | 82% | *Diff./% | |||||||||||||||
| Date | Max. Temp. (°C) 09/09h | Min. Temp. (°C) 09/09h | Grass Min. Temp. (°C) 21/09h | Earth (30cms) Temp. (°C) 09h | Sun (Hours) 00/00h | R'fall (MM) 09/09h | Wind Dir'n 09h | Mean Wind Speed (MPH) 00/00h | Max. Gust Speed (MPH) 00/00h | Cloud Cover (Oktas) 09h | Mean MSL Air Pressure (mB) 00/00h | Mean Rel. Humd. (%) 00/00h | Mean Temp. (°C) 00/00h | Fog (vis. <1000m @ 09h) | Fog (vis. <200m @ 09h) | Snow or Rain and Snow 00/00h | Snow Lying @ 09h (>50% cover) | Hail 00/00h | Thunder 00/00h | Date |
Differences from average:
Differences from average shown in red. Reference periods used are as follows: Temperature 30 Years 1976/2005; rainfall 30 Years 1971/2000; sunshine 30 Years 1971/2000.
(*The differences from average quoted during the course of the month relate to the cumulative daily averages up to the date of the last observation, not the averages for the month as a whole)
Additional Data:
Rainfall Duration N/A
Air Frost Duration 6.8 hours
Graphs and Charts:
Click on the following links to view this month's graphs and charts.....
1. Daily Maximum, Minimum & Grass Minimum Temperatures
2. Daily Maximum & Minimum Temperatures (with 30 Year Comparative Means)
3. Daily Earth (30 cms Depth) Temperature @ 0900 GMT 4. Daily Rainfall 5. Daily Sunshine
6. Daily Maximum Gust & Mean Wind Speed 7. Daily Wind Direction @ 0900 GMT
8. Daily Mean MSL Air Pressure 9. Daily Mean Relative Humidity 10. Thermograph
11. Barograph 12. Hygrograph 13. Anemograph 14. Wind Direction
15. Rainfall Intensity & Duration
February 2011 Weather Review:
......and click on the link below for a text report of the February 2011 weather in Royston
February (since 1973) at Royston (Iceni) Weather Station:
Mean day maximum temperature (30 years 1981/2010) 7.4°C
Mean night minimum temperature (30 years 1981/2010) 2.0°C
Highest temperature 18.5°C (13th February 1998); lowest temperature -10.5°C (12th & 13th February 1985)
Lowest grass minimum temperature -14.5°C (10th February 1986)
Warmest February 1990 (Mean temperature 8.1°C); coldest February 1986 (Mean temperature -1.6°C)
Average February rainfall (30 years 1981/2010) 38.5 mm
Wettest February 2001 (Rainfall 90.7 mm); driest February 1998 (Rainfall 4.8 mm)
Wettest Day 7th February 2001 (Rainfall 21.8 mm);
Highest number of "rain days" (0.2 mm or more) 24 (2010); lowest number of "rain days" 5 (1998)
Highest number of days with thunder 2 (1995)
Highest number of air frosts 24 (1986)
Highest number of ground frosts 25 (1986)
Highest number of days with snow falling 15 (1986)
Highest number of days with snow lying (ground with more than 50% snow cover @ 0900 GMT) 23 (1986)
|
|
|
|
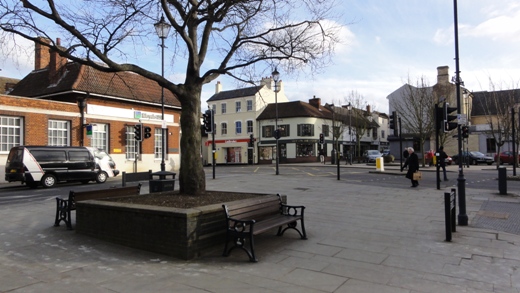
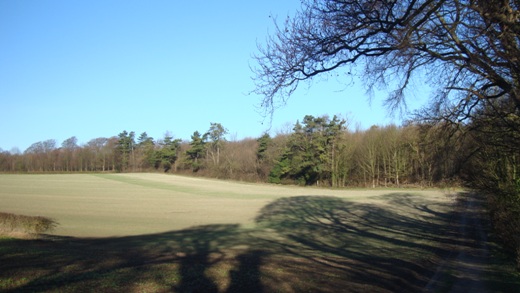
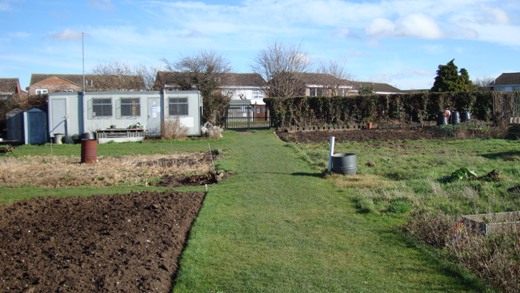
| This is the Cross at Royston as viewed from the north side on 7th February 2011 at 1447 GMT. At this point the ancient Icknield Way (E-W) is crossed by the Roman Ermine Street (N-S). The Icknield Way is today represented by Melbourn Street running eastwards to the left of the photograph and Baldock Street westwards to the right, whilst the photographer's standpoint is by Ermine Street, represented by Lower King Street. In the background is the (barely visible) famous Royse Stone at the intersection of the two roads. A hole in the top of the Stone originally housed a wayside cross to mark this intersection. Today the Royse Stone marks the beginning and end of the Hertfordshire Way, a 195 mile footpath around the county. Not apparent from the photograph is the very strong wind affecting the town at this time, mean speed 18 knots, gusting to 37 knots, from the WSW. The temperature is 10.7°C; a very mild maximum temperature of 12.0°C was achieved that day. | Early morning shadows from a line of large beech trees on the Burloes estate to the E of Royston emphasise the bright sunshine in evidence on 8th February 2011 (at 0924 GMT). The conditions here were unusual for the month, which has been rather dull, particularly in the mornings at this time. The 7 day period from 17th to 23rd inclusive was notably dull with absolutely no sunshine recorded! This dullness has not hampered the temperatures, however, as February has been mild and the first Winter month for 3 years to experience an above average mean temperature. The main field in the picture is believed to have been set with oats which started to appear not long after the record breaking cold December 2010, and now give the field a green sheen when viewed closer up. A NNE breeze of mean speed 3 knots gusting to 4 knots is drifting across the landscape in a temperature of 2.7°C. Sunshine for the day was 8.6 hours. | The northern boundary of the Green Street allotments site in Royston (as seen here at 1202 GMT on 14th February 2011) is shortly to witness the commencement of a major construction project. This is the pedestrian/cycleway route from Melbourn Road to Burns Road incorporating an underpass crossing of the Royston/Cambridge railway line. This will link the two northern sectors of the town at present separated by the railway line. The hedge in the background currently forming the boundary between the allotments and the Coombes Hole track is due to be removed and replaced with a new barrier, whilst plots to the left of the grass path and next to Coombes Hole are to be used temporarily for the construction project. The Royston Allotments and Gardens Association clubhouse as seen in the picture is on one of these plots and is scheduled to be replaced by a new clubhouse nearer to the camera. The temperature is 7.8°C in the bright sunshine (total for the day 7.5 hours). |
Return to Welcome to Royston (Iceni) Weather Station page
(This page last updated 10th March 2011 2121 GMT)