Royston (Iceni) Weather Station
Daily Weather Observations - November 2007
(All Times GMT)
| Date | Max. Temp. (°C) 09/09h | Min. Temp. (°C) 09/09h | Grass Min. Temp. (°C) 21/09h | Earth (30cms) Temp. (°C) 09h | Sun (Hours) 00/00h | R'fall (MM) 09/09h | Wind Dir'n 09h | Mean Wind Speed (MPH) 00/00h | Max. Gust Speed (MPH) 00/00h | Cloud Cover (Oktas) 09h | Mean MSL Air Pressure (mB) 00/00h | Mean Rel. Humd. (%) 00/00h | Mean Temp. (°C) 00/00h | Fog (vis. <1000m @ 09h) | Fog (vis. <200m @ 09h) | Snow or Rain and Snow 00/00h | Snow Lying @ 09h (>50% cover) | Hail 00/00h | Thunder 00/00h | Date |
| 1 | 16.5 | 9.0 | 6.1 | 10.6 | 4.7 | 0.0 | SW | 5.7 | 23 | 1 | 1028.7 | 91.9 | 11.8 | 0 | 0 | 0 | 0 | 0 | 0 | 1 |
| 2 | 16.1 | 10.9 | 8.0 | 10.9 | 3.7 | 0.0 | SW | 2.7 | 14 | 0 | 1031.0 | 89.0 | 12.4 | 0 | 0 | 0 | 0 | 0 | 0 | 2 |
| 3 | 14.0 | 7.7 | 4.9 | 10.9 | 1.7 | 0.0 | SW | 3.2 | 18 | 7 | 1028.5 | 94.3 | 10.3 | 0 | 0 | 0 | 0 | 0 | 0 | 3 |
| 4 | 12.1 | 4.3 | -0.2 | 10.9 | 7.8 | 0.0 | E | 0.1 | 7 | 3 | 1027.5 | 89.0 | 6.9 | 0 | 0 | 0 | 0 | 0 | 0 | 4 |
| 5 | 11.5 | 4.5 | -1.0 | 10.0 | 0.4 | 0.1 | S | 6.4 | 30 | 7 | 1024.3 | 88.9 | 8.1 | 0 | 0 | 0 | 0 | 0 | 0 | 5 |
| 6 | 11.5 | 3.8 | 1.1 | 9.8 | 8.0 | 0.0 | W | 5.2 | 21 | 0 | 1029.4 | 82.9 | 7.0 | 0 | 0 | 0 | 0 | 0 | 0 | 6 |
| 7 | 13.6 | 7.2 | 5.5 | 9.2 | 0.9 | 0.0 | SW | 9.1 | 32 | 8 | 1022.3 | 83.0 | 10.2 | 0 | 0 | 0 | 0 | 0 | 0 | 7 |
| 8 | 13.5 | 9.0 | 6.9 | 9.6 | 0.5 | 2.6 | SW | 9.8 | 39 | 7 | 1013.8 | 84.7 | 9.3 | 0 | 0 | 0 | 0 | 0 | 0 | 8 |
| 9 | 11.3 | 3.4 | 0.5 | 9.5 | 7.6 | 0.1 | W | 8.9 | 37 | 0 | 1021.0 | 70.5 | 6.0 | 0 | 0 | 0 | 0 | 0 | 0 | 9 |
| 10 | 13.0 | 7.0 | 5.3 | 8.9 | 0.1 | 0.0 | W | 11.5 | 39 | 8 | 1017.2 | 85.5 | 10.8 | 0 | 0 | 0 | 0 | 0 | 0 | 10 |
| 11 | 11.5 | 10.0 | 8.1 | 9.5 | 1.3 | 0.0 | W | 8.5 | 37 | 8 | 1014.6 | 79.0 | 8.5 | 0 | 0 | 0 | 0 | 0 | 0 | 11 |
| 12 | 7.7 | -0.1 | -3.1 | 9.0 | 6.6 | 1.6 | W | 3.4 | 14 | 5 | 1022.4 | 81.2 | 2.4 | 0 | 0 | 0 | 0 | 0 | 0 | 12 |
| 13 | 9.4 | 2.0 | 0.3 | 8.1 | 0.4 | 0.1 | SW | 7.2 | 30 | 8 | 1010.9 | 91.2 | 5.9 | 0 | 0 | 0 | 0 | 0 | 0 | 13 |
| 14 | 9.9 | 4.7 | 2.7 | 8.3 | 3.7 | 0.1 | NW | 2.5 | 28 | 1 | 1016.4 | 91.2 | 5.0 | 0 | 0 | 0 | 0 | 0 | 0 | 14 |
| 15 | 7.5 | -0.8 | -5.1 | 7.8 | 7.6 | 0.0 | W | 0.1 | 7 | 0 | 1025.2 | 86.7 | 1.9 | 0 | 0 | 0 | 0 | 0 | 0 | 15 |
| 16 | 7.5 | 0.5 | -3.9 | 6.7 | 7.5 | TR | SW | 2.7 | 14 | 1 | 1026.4 | 82.2 | 3.1 | 0 | 0 | 0 | 0 | 0 | 0 | 16 |
| 17 | 7.4 | 1.7 | -0.3 | 6.0 | 0.2 | 0.1 | S | 5.8 | 25 | 7 | 1021.1 | 93.1 | 5.1 | 0 | 0 | 0 | 0 | 0 | 0 | 17 |
| 18 | 6.4 | 4.6 | 2.7 | 6.5 | 0.0 | 8.4 | SE | 6.9 | 37 | 8 | 1000.9 | 87.1 | 4.2 | 0 | 0 | 1 | 0 | 0 | 0 | 18 |
| 19 | 8.9 | 1.5 | 0.8 | 6.5 | 1.1 | 8.1 | SE | 4.2 | 28 | 3 | 998.0 | 97.4 | 6.3 | 0 | 0 | 0 | 0 | 0 | 0 | 19 |
| 20 | 10.0 | 5.9 | 3.1 | 7.0 | 0.0 | 2.2 | E | 1.4 | 18 | 8 | 1000.2 | 99.7 | 7.4 | 0 | 0 | 0 | 0 | 0 | 0 | 20 |
| 21 | 11.1 | 8.2 | 5.9 | 7.5 | 6.3 | 15.9 | S | 4.3 | 25 | 1 | 997.2 | 95.0 | 8.6 | 0 | 0 | 0 | 0 | 0 | 0 | 21 |
| 22 | 9.5 | 6.9 | 5.7 | 7.7 | 3.6 | 0.5 | W | 3.7 | 23 | 8 | 1000.9 | 95.9 | 7.5 | 0 | 0 | 0 | 0 | 0 | 0 | 22 |
| 23 | 5.5 | 1.1 | -0.8 | 7.8 | 6.1 | 0.0 | NW | 4.2 | 25 | 0 | 1020.2 | 89.9 | 2.7 | 0 | 0 | 0 | 0 | 0 | 0 | 23 |
| 24 | 7.8 | -1.0 | -5.1 | 6.9 | 0.0 | 0.0 | S | 7.8 | 32 | 8 | 1021.5 | 88.0 | 3.4 | 0 | 0 | 0 | 0 | 0 | 0 | 24 |
| 25 | 9.3 | 4.9 | 2.1 | 6.5 | 3.2 | 0.0 | W | 6.7 | 30 | 4 | 1021.8 | 91.0 | 6.8 | 0 | 0 | 0 | 0 | 0 | 0 | 25 |
| 26 | 6.9 | 2.4 | -1.5 | 6.9 | 1.5 | 0.1 | W | 1.3 | 12 | 7 | 1028.9 | 83.6 | 5.1 | 0 | 0 | 0 | 0 | 0 | 0 | 26 |
| 27 | 9.5 | 6.0 | 2.6 | 7.0 | 0.0 | 0.8 | SE | 2.3 | 12 | 8 | 1025.6 | 99.1 | 7.7 | 0 | 0 | 0 | 0 | 0 | 0 | 27 |
| 28 | 10.2 | 6.8 | 5.2 | 7.5 | 2.0 | 0.1 | S | 6.6 | 25 | 8 | 1012.7 | 95.9 | 8.6 | 0 | 0 | 0 | 0 | 0 | 0 | 28 |
| 29 | 9.7 | 7.5 | 5.5 | 7.8 | 5.7 | 0.0 | SW | 7.2 | 28 | 3 | 1004.7 | 87.8 | 7.2 | 0 | 0 | 0 | 0 | 0 | 0 | 29 |
| 30 | 13.3 | 4.9 | 3.2 | 7.5 | 2.0 | 3.6 | S | 10.7 | 35 | 8 | 1000.2 | 91.9 | 10.3 | 0 | 0 | 0 | 0 | 0 | 0 | 30 |
| Total/Mean | 10.4 | 4.8 | 2.2 | 8.3 | 93.9 | 44.4 | X | 5.3 | X | 4.8 | 1017.1 | 88.9 | 7.0 | 0 | 0 | 1 | 0 | 0 | 0 | Total/Mean |
| *Diff./% | +0.7 | -0.1 | 138% | 85% | *Diff./% | |||||||||||||||
| Date | Max. Temp. (°C) 09/09h | Min. Temp. (°C) 09/09h | Grass Min. Temp. (°C) 21/09h | Earth (30cms) Temp. (°C) 09h | Sun (Hours) 00/00h | R'fall (MM) 09/09h | Wind Dir'n 09h | Mean Wind Speed (MPH) 00/00h | Max. Gust Speed (MPH) 00/00h | Cloud Cover (Oktas) 09h | Mean MSL Air Pressure (mB) 00/00h | Mean Rel. Humd. (%) 00/00h | Mean Temp. (°C) 00/00h | Fog (vis. <1000m @ 09h) | Fog (vis. <200m @ 09h) | Snow or Rain and Snow 00/00h | Snow Lying @ 09h (>50% cover) | Hail 00/00h | Thunder 00/00h | Date |
Differences from average:
Differences from average shown in red. Reference periods used are as follows: Temperature 30 Years 1976/2005; rainfall 30 Years 1971/2000; sunshine 30 Years 1971/2000.
(*The differences from average quoted during the course of the month relate to the cumulative daily averages up to the date of the last observation, not the averages for the month as a whole)
Additional Data:
Rainfall Duration 45.6 hours
Air Frost Duration 9.3 hours
Graphs and Charts:
Click on the following links to view this month's graphs and charts.....
1. Daily Maximum, Minimum & Grass Minimum Temperatures
2. Daily Maximum & Minimum Temperatures (with 30 Year Comparative Means)
3. Daily Earth (30 cms Depth) Temperature @ 0900 GMT 4. Daily Rainfall 5. Daily Sunshine
6. Daily Maximum Gust & Mean Wind Speed 7. Daily Wind Direction @ 0900 GMT
8. Daily Mean MSL Air Pressure 9. Daily Mean Relative Humidity 10. Thermograph
11. Barograph 12. Hygrograph 13. Anemograph 14. Wind Direction
15. Sunshine Duration 16. Rainfall Intensity & Duration
November 2007 Weather Review:
......and click on the link below for a text report of the November 2007 weather in Royston
November (since 1972) at Royston (Iceni) Weather Station:
Mean day maximum temperature (30 years 1976/2005) 9.7°C
Mean night minimum temperature (30 years 1976/2005) 4.9°C
Highest temperature 17.8°C (2nd November 1984); lowest temperature -6.9°C (30th November 1978)
Lowest grass minimum temperature -10.5°C (30th November 1978)
Warmest November 1994 (Mean temperature 10.5°C); coldest November 1985 (Mean temperature 4.2°C)
Average November rainfall (30 years 1971/2000) 52.4 mm
Wettest November 2000 (Rainfall 118.2 mm); driest November 1978 (Rainfall 17.2 mm)
Wettest Day 18th November 2004 (Rainfall 28.3 mm)
Highest number of "rain days" (0.2 mm or more) 23 (1974); lowest number of "rain days" 7 (1978)
Highest number of days with thunder 2 (1974)
Highest number of air frosts 10 (1985, 1996)
Highest number of ground frosts 17 (1985, 1988)
Highest number of days with snow falling 4 (1980, 1985)
Highest number of days with snow lying (ground with more than 50% snow cover @ 0900 GMT) 5 (1988)
|
|
|
|
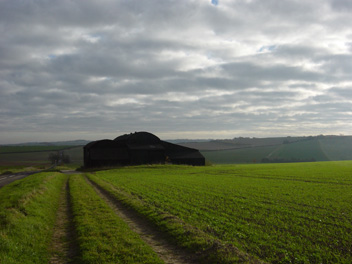
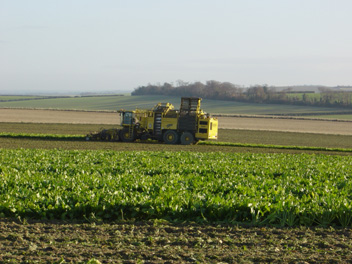
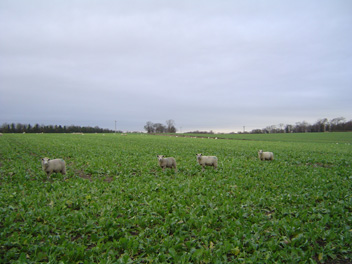
| This large black barn is a notable landmark on the B1039 Royston to Saffron Walden Road some 3 km SE of Royston. A public bridleway commences just behind the barn, then descends into a valley before climbing the distant ridge at centre right from where it drops down into the village of Barley. To the left of the barn is Poorsland, the location of the adjacent photograph. This view was as seen at 0910 GMT on 3rd November 2007. At that time a SW wind of mean speed 5 knots gusting to 12 knots was drifting across this very open downland area. The temperature was 9.7°C. Although it was briefly sunny for the picture the day was mainly cloudy and only 1.7 hours sunshine was recorded. | Being mid-November (14th at 0924 GMT) the beet sugar campaign in the region is in full swing and this acreage of sugar beet at Poorsland 3 km SE of Royston is destined to contribute to the 7 million tonnes of sugar beet (the UK's entire crop) from 5000 suppliers to be processed in the state-of-the-art plants of British Sugar. This harvesting machine is lifting the crop for temporary storage on site before being transported to an East Anglian processing plant, most likely Bury St. Edmunds or Wissington. This is an unusual crop for the Royston area where cereal crops are more preferred in the light chalk soils. The temperature at this time is 5.3°C, in a WNW wind of 3 knots gusting to 10 knots. Sunshine for the day was 3.7 hours. | The four sheep posing for the camera in this photograph are part of a much larger flock which has been folded over on this fast growing green crop which was sown immediately after the wheat harvest in the Summer. The location is the Burloes estate on the eastern boundary of Royston and the time 0938 GMT on 26th November 2007. It is a rather grey but relatively calm morning and the temperature is 4.5°C. A light breeze from the W of mean speed 1 knot gusting to 4 knots heralds a day which saw a maximum gust speed of only 12 knots and a maximum temperature of 6.9°C (which is 1.5°C below the 30 Year (1976/2005) average for this day). Sunshine recorded over the day was 1.6 hours. |
Return to Welcome to Royston (Iceni) Weather Station page
(This page last updated 8th December 2007 2108 GMT)