Royston (Iceni) Weather Station
Daily Weather Observations - August 2000
| Date | Max | Min | Grass | Earth | Sunshine | Rainfall | Wind | Mean | Max | Cloud | Mean | Mean | Mean | Fog | Fog | Snow | Snow | Hail | Thunder | Date |
| Temp | Temp | Min | (30cm) | (Hrs) | (MM) | Direc- | Wind | Gust | Cover | MSL | Rel. | Temp | (vis.< | (vis.< | or | Lying | 00/00h | 00/00h | ||
| (°C) | (°C) | Temp | Temp | 00/00h | 09/09h | tion | Speed | Speed | (Oktas) | Pressure | Humd | (°C) | 1000m) | 200m | Rain/ | (>50% | ||||
| 09/09h | 09/09h | (°C) | (°C) | 09h | (mph) | (mph) | 09h | (mb) | (%) | 00/00h | 09h | 09h | Snow | cover | ||||||
| 09/09h | 09h | 00/00h | 00/00h | 00/00h | 00/00h | 00/00h | 09h) | |||||||||||||
| 1 | 24.5 | 14.4 | 13.0 | 19.3 | 5.63 | 0.0 | W | 4.6 | 23 | 5 | 1015.8 | 64.3 | 19.4 | 0 | 0 | 0 | 0 | 0 | 0 | 1 |
| 2 | 23.2 | 12.0 | 10.5 | 19.0 | 10.37 | 3.4 | SW | 7.3 | 32 | 7 | 1012.1 | 77.1 | 17.2 | 0 | 0 | 0 | 0 | 0 | 0 | 2 |
| 3 | 20.3 | 14.0 | 12.9 | 18.8 | 4.09 | 12.4 | W | 2.7 | 21 | 3 | 1013.2 | 87.5 | 15.8 | 0 | 0 | 0 | 0 | 1 | 1 | 3 |
| 4 | 22.0 | 13.5 | 12.2 | 18.5 | 5.30 | 0.0 | NW | 1.8 | 16 | 7 | 1022.2 | 77.9 | 16.5 | 0 | 0 | 0 | 0 | 0 | 0 | 4 |
| 5 | 23.3 | 12.7 | 10.4 | 18.7 | 7.51 | 0.0 | W | 1.8 | 16 | 6 | 1023.8 | 68.0 | 18.0 | 0 | 0 | 0 | 0 | 0 | 0 | 5 |
| 6 | 24.0 | 16.7 | 14.5 | 19.0 | 2.90 | TR | NW | 3.6 | 21 | 7 | 1023.4 | 73.5 | 20.1 | 0 | 0 | 0 | 0 | 0 | 0 | 6 |
| 7 | 24.0 | 15.1 | 13.1 | 19.1 | 3.61 | 0.5 | NW | 2.5 | 18 | 6 | 1022.9 | 78.1 | 19.3 | 0 | 0 | 0 | 0 | 0 | 0 | 7 |
| 8 | 23.8 | 15.6 | 14.3 | 19.5 | 4.93 | TR | NW | 1.4 | 14 | 5 | 1020.2 | 79.4 | 19.2 | 0 | 0 | 0 | 0 | 0 | 0 | 8 |
| 9 | 23.5 | 14.5 | 13.6 | 19.5 | 7.21 | 0.0 | SW | 5.5 | 25 | 2 | 1016.9 | 76.4 | 19.4 | 0 | 0 | 0 | 0 | 0 | 0 | 9 |
| 10 | 22.7 | 17.1 | 16.1 | 19.9 | 3.26 | 0.0 | W | 3.9 | 21 | 8 | 1014.5 | 72.2 | 19.4 | 0 | 0 | 0 | 0 | 0 | 0 | 10 |
| 11 | 25.2 | 15.0 | 11.5 | 19.5 | 9.30 | 0.0 | NW | 1.1 | 14 | 4 | 1014.5 | 63.1 | 19.4 | 0 | 0 | 0 | 0 | 0 | 0 | 11 |
| 12 | 27.4 | 14.2 | 12.7 | 19.7 | 13.20 | 0.0 | S | 3.6 | 18 | 0 | 1012.5 | 64.1 | 21.0 | 0 | 0 | 0 | 0 | 0 | 0 | 12 |
| 13 | 24.5 | 15.2 | 13.5 | 19.9 | 1.94 | 0.7 | SW | 3.7 | 18 | 6 | 1013.8 | 77.5 | 19.5 | 0 | 0 | 0 | 0 | 0 | 0 | 13 |
| 14 | 23.9 | 17.1 | 15.9 | 19.7 | 2.32 | 0.0 | SW | 7.2 | 30 | 8 | 1013.7 | 79.5 | 20.3 | 0 | 0 | 0 | 0 | 0 | 0 | 14 |
| 15 | 24.4 | 14.7 | 13.5 | 19.6 | 7.90 | 0.2 | W | 5.2 | 23 | 3 | 1017.1 | 66.8 | 19.1 | 0 | 0 | 0 | 0 | 0 | 0 | 15 |
| 16 | 22.2 | 14.3 | 13.0 | 19.9 | 5.00 | TR | W | 5.2 | 23 | 7 | 1011.9 | 69.6 | 18.5 | 0 | 0 | 0 | 0 | 0 | 0 | 16 |
| 17 | 21.5 | 14.0 | 12.5 | 19.5 | 7.25 | 0.1 | W | 6.1 | 30 | 4 | 1009.9 | 69.0 | 17.4 | 0 | 0 | 0 | 0 | 0 | 0 | 17 |
| 18 | 19.8 | 13.0 | 11.4 | 19.0 | 2.44 | 2.8 | SW | 5.9 | 18 | 7 | 1010.5 | 88.3 | 15.9 | 0 | 0 | 0 | 0 | 0 | 0 | 18 |
| 19 | 22.2 | 14.0 | 12.6 | 18.5 | 8.03 | 0.0 | SW | 4.1 | 23 | 3 | 1009.2 | 71.0 | 17.4 | 0 | 0 | 0 | 0 | 0 | 0 | 19 |
| 20 | 21.0 | 9.6 | 7.0 | 18.5 | 6.06 | 17.8 | NE | 0.5 | 14 | 1 | 1012.4 | 73.6 | 15.2 | 0 | 0 | 0 | 0 | 0 | 1 | 20 |
| 21 | 22.1 | 10.3 | 8.0 | 18.0 | 10.81 | 0.0 | W | 1.9 | 21 | 2 | 1013.3 | 74.9 | 15.2 | 0 | 0 | 0 | 0 | 0 | 0 | 21 |
| 22 | 22.2 | 10.8 | 8.0 | 18.0 | 8.98 | 0.0 | S | 0.9 | 12 | 1 | 1019.4 | 68.7 | 16.2 | 0 | 0 | 0 | 0 | 0 | 0 | 22 |
| 23 | 22.8 | 10.5 | 8.0 | 18.0 | 7.85 | 0.0 | NE | 1.2 | 21 | 3 | 1023.7 | 77.1 | 15.7 | 0 | 0 | 0 | 0 | 0 | 0 | 23 |
| 24 | 26.0 | 9.3 | 7.0 | 17.7 | 10.77 | 0.0 | N | 1.0 | 14 | 0 | 1023.6 | 73.0 | 17.1 | 0 | 0 | 0 | 0 | 0 | 0 | 24 |
| 25 | 25.5 | 13.4 | 10.4 | 18.1 | 12.11 | TR | SE | 2.5 | 30 | 0 | 1019.1 | 72.8 | 18.8 | 0 | 0 | 0 | 0 | 0 | 0 | 25 |
| 26 | 22.4 | 16.8 | 16.1 | 18.6 | 0.60 | 0.5 | CALM | 4.2 | 28 | 8 | 1008.8 | 85.8 | 18.4 | 0 | 0 | 0 | 0 | 0 | 0 | 26 |
| 27 | 23.0 | 13.2 | 11.5 | 18.2 | 8.77 | 0.0 | SW | 4.7 | 28 | 2 | 1013.0 | 75.9 | 17.2 | 0 | 0 | 0 | 0 | 0 | 0 | 27 |
| 28 | 22.1 | 11.6 | 9.5 | 18.1 | 6.96 | 0.5 | SW | 3.5 | 23 | 3 | 1016.7 | 75.8 | 15.5 | 0 | 0 | 0 | 0 | 0 | 0 | 28 |
| 29 | 22.6 | 10.7 | 7.7 | 17.9 | 9.44 | 0.0 | NW | 1.3 | 12 | 1 | 1019.4 | 73.0 | 15.9 | 0 | 0 | 0 | 0 | 0 | 0 | 29 |
| 30 | 21.5 | 9.5 | 6.6 | 17.9 | 9.51 | 0.0 | NE | 1.3 | 16 | 2 | 1019.0 | 76.5 | 14.7 | 0 | 0 | 0 | 0 | 0 | 0 | 30 |
| 31 | 21.5 | 10.7 | 7.4 | 17.5 | 5.82 | 4.4 | SW | 4.2 | 23 | 2 | 1009.4 | 75.3 | 15.8 | 0 | 0 | 0 | 0 | 0 | 0 | 31 |
| Mean/Total | 23.1 | 13.3 | 11.4 | 18.8 | 209.87 | 43.3 | X | 3.3 | X | 4.0 | 1016.0 | 74.4 | 17.7 | 0 | 0 | 0 | 0 | 1 | 2 | Mean/Total |
| (+0.9) | (+0.9) | (118%) | (82%) |
Note: In line with standard meteorological practice the 24 hour maximum temperature and rainfall are read at 0900 GMT and credited to the previous day e.g. data shown above for 1st actually read at 0900 GMT on 2nd and represents the previous 24 hours. The 24 hour minimum and grass minimum temperatures are similarly observed at 0900 GMT but are credited to the day of the reading (e.g. observations made at 0900 GMT on 2nd shown against 2nd and represent previous 24 hours). This is the reason why at daily update of the above table the minimum and grass minimum temperatures appear to be "ahead" of the other data mentioned. (This explanation given in response to a query received).
Differences from average shown in red. Reference periods used are Temperature 25 Years 1973/1997; Rainfall 35 Years 1961/1995; Sunshine 30 Years 1961/1990.
Click on the links below to access this month's graphs and charts......
1. Daily Maximum, Minimum, and Grass Minimum Temperatures
2. Daily Maximum and Minimum Temperatures (with 25 Year Comparative Means)
3. Daily Earth (30 cms Depth) Temperature 4. Daily Rainfall 5. Daily Sunshine
6. Wind Speed 7. Mean MSL Air Pressure 8. Relative Humidity
9. Thermograph 10.Barograph 11. Hygrograph 12. Anemograph
13. Wind Direction (Graph) 14. Wind Direction @ 0900 GMT
15. Sunshine Duration 16. Hyetograph (Rainfall Intensity & Duration)
...... and for a text report of the August 2000 weather in Royston click on the following link
August (since 1972) at Royston (Iceni) Weather Station:
Mean day maximum temperature (25 years 1973/1997) 22.2°C
Mean night minimum temperature (25 years 1973/1997) 12.4°C
Highest temperature 35.0°C (3rd August 1990); lowest temperature 5.1°C (23rd August1993)
Lowest grass minimum temperature 1.0°C (23rd August1993)
Hottest August 1997 (Mean temperature 20.9°C); coolest August 1986 (Mean temperature 14.9°C)
Average August rainfall (35 years 1961/1995) 52.8 mm
Wettest August 1974 (Rainfall 109.0 mm); driest August 1995 (Rainfall 12.1 mm)
Wettest Day 31st August 1988 (Rainfall 45.3 mm);
Highest number of "rain days" (0.2 mm or more) 16 (1974, 1985 & 1992); lowest number of "rain days" 4 (1995)
Highest number of days with thunder 6 (1999)
|
|
|
|
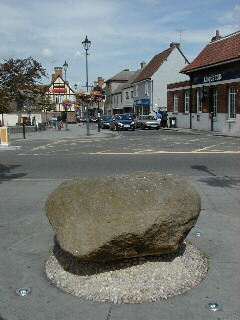
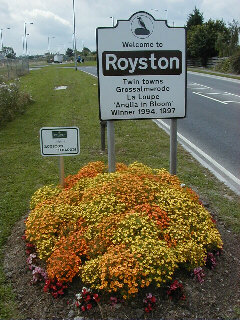
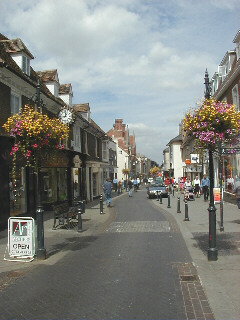
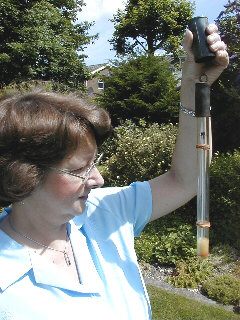
| This picture shows the famous Royse Stone which is located in the centre of Royston at the intersection of Ermine Street and the Icknield Way. The Stone, which was originally the base of a cross, was moved several times in the last century and now rests on the south side of the junction. The photograph, which was taken on 7th August 2000 at 1140 GMT, shows the view northwards into Kneesworth Street. The temperature at 23.7°C has almost reached the day's maximum of 24.0°C, whilst the town is subject to a north-westerly wind of mean speed 5 knots, gusting to 12 knots. | Summer flowers are in profusion around Royston again this year, the entrances to the town being no exception. This scene is on the A10 trunk road where it enters the town from the north-east (from Cambridge and Kings Lynn). The photograph was taken at 1122 GMT on 14th August 2000 under a mainly cloudy sky (only 2.3 hours of sunshine recorded that day). The temperature is 22.9°C with a fairly fresh south-westerly wind (mean speed 9 knots, gusting to 22 knots). Under construction to the left of this picture is a new housing development which extends the northern edge of the town at this point to the A505 by-pass. | More flowers, this time in hanging baskets in High Street, Royston, pictured on 7th August 2000 at 1147 GMT. Shoppers are enjoying warm sunshine (temperature 23.3°C in a north-westerly breeze, total sunshine for the day 3.6 hours). This narrow street (the original Ermine Street) forms the principal shopping area of Royston and was once the main north/south route through the town. Some years ago the High Street was by-passed a few hundred metres to the east and now bears no through traffic. The photograph was taken towards the southern end of the High Street, looking north. Running off to the right is the Angel Pavement shopping precinct. | Measuring the 30 cm earth temperature at Royston (Iceni) Weather Station. Here the observer has withdrawn the earth thermometer from its protective metal tube in the ground and is reading the temperature from the scale on the thermometer which is housed within an outer glass sheath. The temperature must be read immediately on withdrawal of the thermometer from the ground before it can be affected by the ambient air temperature. The wax surrounding the thermometer bulb (the straw coloured substance at the bottom of the sheath) is designed to protect the thermometer bulb from the temperature of the air long enough for the reading to be taken. |
Apologies for the loss of service on this page on 23/08/00. This was due to an internal server error.
Return to Welcome to Royston (Iceni) Weather Station page
(This page last updated 9th September 2000 2053 GMT)