Royston (Iceni) Weather Station
Global Warming......has it reached Royston yet?
The record high temperatures in February 1998 once again highlighted the much discussed phenomenon of global warming. On 13th February 1998 the temperature in Royston reached a seasonally exceptional 18.5°C , its highest value in February in at least the previous 25 years, and was followed by 17.3°C on 14th and 15.9°C on 15th. (It is perhaps ironic that averaged over the 25 years 1973/1997 14th February has been the coldest day of the year in Royston, but for the moment that is a different issue).
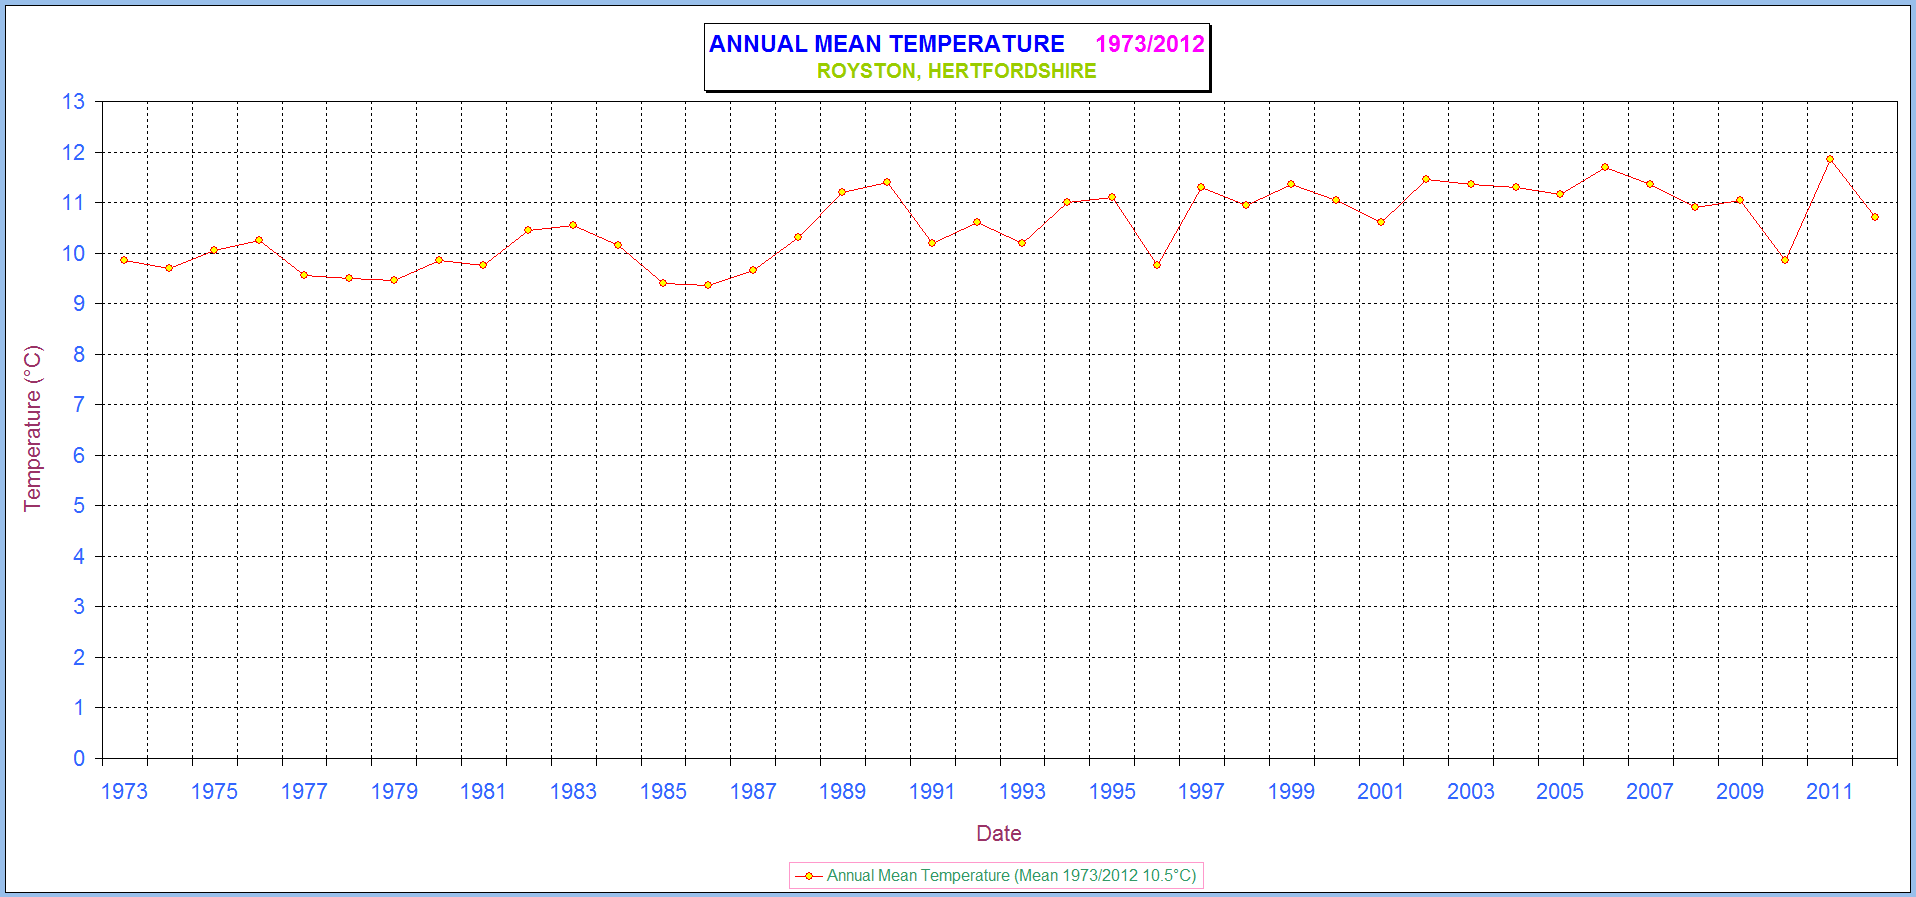
The annual mean temperature is probably the best indicator of any long term temperature trends, and to establish whether there is any evidence in the Royston meteorological records to support the global warming theory the annual mean temperature for each of the last 34 years was calculated. The results are displayed in the graph below.

It can be seen from this graph that the 15 warmest years in the period 1973/2006 have all occurred in the last 18 years. During the 1970’s the annual mean temperature remained relatively stable, but since 1982 has shown greater variation from year to year. A steady rise occurred at the end of the 1980’s, which has been generally maintained during the 1990’s and into the new century, except for 1996 when the mean temperature fell back to earlier levels.
This anomaly was reversed in 1997, however, when the mean temperature rose to 11.3 °C, which was only 0.1°C lower than in 1990, the warmest year in the previous 25 years. Then followed another 9 warmer than average years, 1998, 1999, 2000, 2001, 2002, 2003, 2004, 2005 and 2006, the mean temperature in 1999 failing to reach the record 1990 value by less than 0.1°C, and the 2002 mean temperature just (by less than 0.1°C) exceeding 1990 for 2002 to become the warmest year in the last 30 years. Subsequently 2006 became the warmest year since at least 1972 in Royston with a mean temperature 0.2°C higher than in 2002. Also Autumn 2006 was the mildest Autumn since at least 1972. Other notable temperature events in the last 14 years include the record high temperature of 35.0°C on 3rd August 1990, the hottest month of any, August 1997 (now superseded by July 2006 as the hottest month of any), and then the record warm days in February 1998. In 2003 the highest temperature record (any month) was broken twice in August, 35.1°C being recorded on 6th and then 36.4°C on 10th. On 19th July 2006 a temperature of 35.2°C (a new July record) was recorded.
A further indication of the milder conditions is the lack of any prolonged severe winter weather since February 1991 when the last major snowfall and very cold spell occurred. Although a number of severe, but relatively brief, spells (February 1986 excepted) occurred during the 1980's the last severe winter overall was as long ago as 1978/79.
In the 120 months from January 1997 to December 2006 inclusive only 26 have registered a below average mean temperature, and 6 of these by only 0.1°C! The following table shows the monthly mean temperature differences from the 25 Year (1973/1997), 30 Year (1973/2002) and 30 Year (1976/2005) averages.
Monthly Mean Temperature - Differences from 25 Year * (1973/1997) average ( * 30 Year (1973/2002) average w.e.f. 2003) (* 30 Year (1976/2005) average w.e.f. 2006)
(* 30 Year (1981/2010) average w.e.f. 2011)
| Month | 25 Year Mean Temp(°C) | 1997 | 1998 | 1999 | 2000 | 2001 | 2002 |
30 Year Mean Temp(°C) |
2003 | 2004 | 2005 |
30 Year Mean Temp(°C) |
2006 | 2007 | 2008 | 2009 | 2010 | 30 Year Mean Temp(°C) | 2011 | 2012 | 2013 | |||||
| January | 4.2 | -2.0 | +1.4 | +1.8 | +1.1 | -0.9 |
+2.3 |
4.4 |
+0.1 |
+1.2 |
+1.8 | 4.4 | -0.2 |
+3.0 |
+3.0 |
-1.2 |
-2.8 |
4.7 |
-0.2 |
+1.5 | -1.2 | |||||
| February | 4.1 | +3.1 | +3.6 | +1.2 | +2.6 | +0.9 | +3.7 | 4.5 |
-0.1 |
+1.1 |
-0.2 | 4.5 | -0.5 | +2.0 |
+1.6 |
-0.2 |
-1.3 | 4.7 | +2.2 | -0.7 | -1.5 | |||||
| March | 6.5 | +2.6 | +1.9 | +1.8 | +1.6 | -0.6 | +1.7 | 6.7 |
+1.5 |
+0.4 |
+0.8 | 7.0 | -1.6 |
+1.1 |
-0.3 |
+0.9 |
+0.1 | 7.2 | +0.4 | +1.7 | -4.3 | |||||
| April | 8.5 | +1.0 | +0.2 | +1.8 | +0.4 | 0.0 |
+1.5 | 8.6 |
+1.5 |
+1.7 |
+1.4 |
8.8 |
+0.7 |
+3.5 |
+0.2 |
+2.3 |
+1.3 |
9.3 |
+4.0 |
-0.6 |
-0.9 |
|||||
| May | 11.8 | +1.1 | +1.9 | +2.2 | +1.2 | +1.5 | +0.9 | 12.0 |
+1.2 |
+1.0 |
+0.5 |
12.2 |
+1.1 |
+0.7 |
+1.9 |
+1.4 |
-0.2 |
12.5 |
+1.3 |
+0.3 |
-1.2 |
|||||
| June | 15.0 | -0.1 | +0.4 | -0.1 | +1.4 | +0.2 | +0.7 | 15.1 |
+2.4 |
+1.8 |
+1.7 |
15.3 |
+2.2 |
+0.8 |
+0.4 |
+0.8 |
+1.2 |
15.5 | +0.2 |
-0.8 |
-0.7 |
|||||
| July | 17.4 | +0.3 | -0.9 | +1.3 | -1.4 | +1.1 |
0.0 |
17.4 |
+1.3 |
-0.2 |
+0.3 |
17.5 |
+4.0 |
-0.6 |
+0.4 |
+0.1 |
+2.0 |
17.8 |
-1.3 |
-1.0 |
||||||
| August | 17.3 | +3.6 | -0.1 | +0.1 | +0.9 | +1.1 | +1.0 | 17.5 |
+2.3 |
+1.5 |
-0.2 |
17.6 |
-0.7 |
-0.9 |
-0.1 |
+0.8 |
-1.0 |
17.7 |
-0.9 |
+0.7 |
||||||
| September | 14.5 | +0.9 | +1.1 | +2.5 | +1.5 | -0.7 | +0.4 | 14.6 |
+1.2 |
+1.6 |
+1.9 |
14.9 |
+3.2 |
+0.2 |
-0.6 |
+0.7 |
-0.2 |
15.1 | +1.8 |
-0.4 |
||||||
| October | 11.0 | -0.3 | -0.1 | +0.3 | +0.2 | +3.3 | -0.1 | 11.1 |
-1.6 |
+0.4 |
+2.9 | 11.3 |
+2.8 |
+0.2 |
-0.6 |
+0.8 |
-0.1 |
11.4 |
+2.4 |
-0.9 |
||||||
| November | 7.1 | +1.8 | -1.6 | +0.7 | +0.5 | +0.6 | +1.8 | 7.2 |
+1.8 |
+0.8 |
-0.6 |
7.3 |
+1.7 |
+0.3 |
+0.2 |
+1.9 |
-1.7 |
7.5 |
+2.9 |
-0.1 |
||||||
| December | 5.1 | +1.1 | +1.0 | -0.1 | +0.9 | -1.6 | +1.0 | 5.1 |
+0.4 |
+0.7 |
-0.2 |
5.1 |
+1.9 |
+0.4 |
-1.1 |
-1.5 |
-4.9 |
5.0 |
+1.4 |
+0.4 |
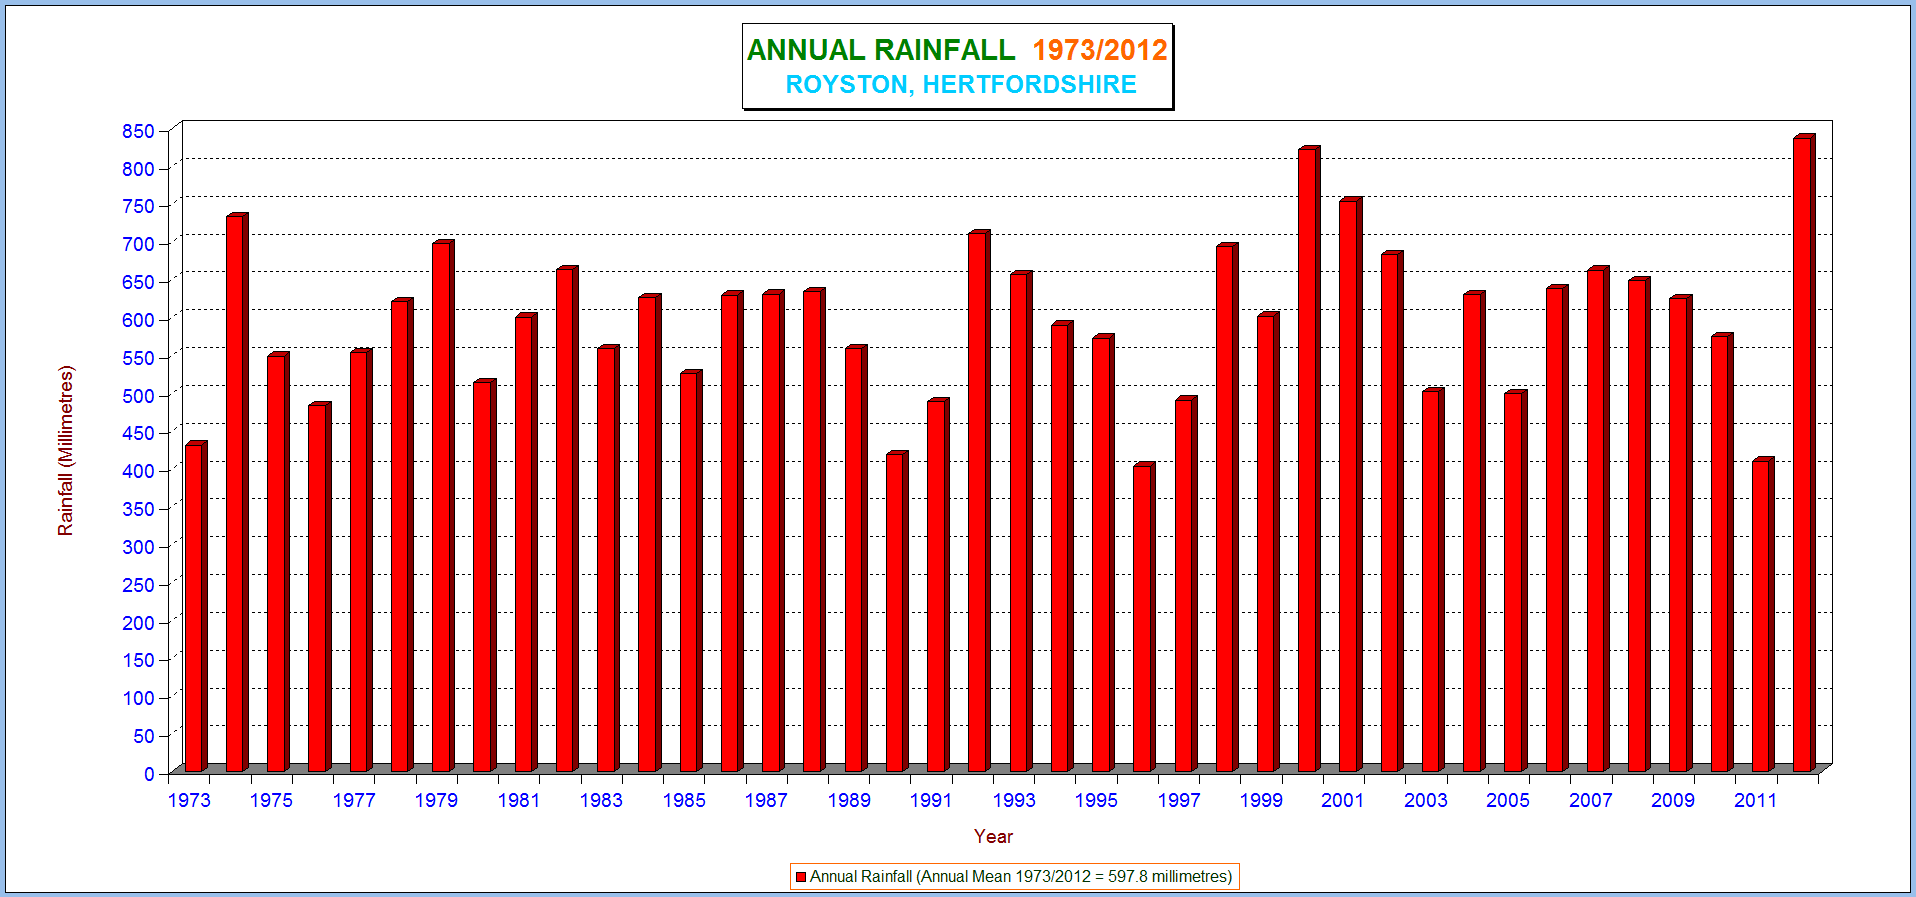
Coupled with the higher temperatures in recent years have been the long dry spells in some years. As shown in the chart below the years of 1990, 1991, 1996, 1997 and 2011were particularly dry.

In conclusion, there is sufficient evidence in the Royston temperature records to show that temperatures have increased in recent years. However, it is still too early to say whether this rise is attributable to human activities on a global scale, or whether it is simply a climatic variation which will be reversed at a later date. What is certain though is that scientists and others will vigorously debate the issue for years to come, perhaps still with no definitive answer as a result.
Richard Barker, Met. Observer, Royston (Iceni) Weather Station
11th February 2000 (Revised 19th February 2001) (Revised 23rd March 2002) (Revised 16th January 2003) (Revised 23rd January 2004)(Revised 28th January 2005)(Revised 13th January 2006)(Revised 30th January 2007)
(The monthly mean temperature differences table above will be updated monthly)
Return to Welcome to Royston (Iceni) Weather Station header page
(This page last updated 1st July 2013 2105 GMT)