Royston (Iceni) Weather Station
Daily Weather Observations - November 2011
(All Times GMT)
| Date | Max. Temp. (°C) 09/09h | Min. Temp. (°C) 09/09h | Grass Min. Temp. (°C) 21/09h | Earth (30cms) Temp. (°C) 09h | Sun (Hours) 00/00h | R'fall (MM) 09/09h | Wind Dir'n 09h | Mean Wind Speed (MPH) 00/00h | Max. Gust Speed (MPH) 00/00h | Cloud Cover (Oktas) 09h | Mean MSL Air Pressure (mB) 00/00h | Mean Rel. Humd. (%) 00/00h | Mean Temp. (°C) 00/00h | Fog (vis. <1000m @ 09h) | Fog (vis. <200m @ 09h) | Snow or Rain and Snow 00/00h | Snow Lying @ 09h (>50% cover) | Hail 00/00h | Thunder 00/00h | Date |
| 1 | 15.1 | 10.7 | 8.7 | 12.1 | 3.3 | 0.0 | SW | 5.4 | 18 | 7 | 1008.6 | 86.0 | 11.8 | 0 | 0 | 0 | 0 | 0 | 0 | 1 |
| 2 | 15.4 | 7.5 | 5.1 | 11.4 | 6.3 | 0.1 | SE | 6.1 | 24 | 2 | 1004.2 | 89.3 | 11.3 | 0 | 0 | 0 | 0 | 0 | 0 | 2 |
| 3 | 17.0 | 13.1 | 12.2 | 11.6 | 0.4 | 22.3 | SE | 6.2 | 22 | 8 | 993.0 | 89.9 | 14.7 | 0 | 0 | 0 | 0 | 0 | 0 | 3 |
| 4 | 15.5 | 11.6 | 10.7 | 12.2 | 2.9 | 0.2 | S | 4.7 | 22 | 8 | 995.2 | 92.0 | 12.8 | 0 | 0 | 0 | 0 | 0 | 0 | 4 |
| 5 | 12.6 | 9.0 | 6.9 | 11.8 | 0.0 | 0.1 | W | 3.4 | 19 | 8 | 1007.8 | 95.7 | 10.7 | 1 | 0 | 0 | 0 | 0 | 0 | 5 |
| 6 | 11.2 | 7.4 | 7.2 | 11.7 | 0.2 | 0.3 | N | 5.6 | 21 | 7 | 1022.5 | 87.7 | 9.4 | 0 | 0 | 0 | 0 | 0 | 0 | 6 |
| 7 | 11.3 | 8.6 | 8.2 | 11.5 | 0.0 | 1.1 | NE | 4.7 | 18 | 8 | 1021.3 | 95.1 | 10.1 | 1 | 0 | 0 | 0 | 0 | 0 | 7 |
| 8 | 10.9 | 9.1 | 8.7 | 11.5 | 0.0 | 1.8 | E | 1.3 | 11 | 8 | 1014.7 | 96.8 | 9.7 | 0 | 0 | 0 | 0 | 0 | 0 | 8 |
| 9 | 14.3 | 9.0 | 8.5 | 11.3 | 3.5 | 0.0 | S | 4.7 | 18 | 8 | 1015.3 | 92.7 | 10.9 | 0 | 0 | 0 | 0 | 0 | 0 | 9 |
| 10 | 13.4 | 9.3 | 6.1 | 11.2 | 2.2 | 0.0 | SE | 2.9 | 19 | 8 | 1017.5 | 92.5 | 11.2 | 0 | 0 | 0 | 0 | 0 | 0 | 10 |
| 11 | 12.1 | 8.4 | 5.4 | 11.2 | 0.0 | 0.0 | SE | 5.8 | 21 | 8 | 1016.0 | 96.1 | 9.7 | 0 | 0 | 0 | 0 | 0 | 0 | 11 |
| 12 | 14.5 | 10.1 | 9.5 | 11.2 | 1.2 | 0.0 | S | 4.0 | 18 | 8 | 1024.9 | 93.5 | 12.4 | 0 | 0 | 0 | 0 | 0 | 0 | 12 |
| 13 | 15.4 | 10.1 | 8.2 | 11.7 | 5.9 | TR | E | 3.1 | 15 | 8 | 1028.1 | 92.1 | 11.2 | 0 | 0 | 0 | 0 | 0 | 0 | 13 |
| 14 | 9.8 | 8.6 | 8.2 | 11.2 | 0.0 | TR | E | 2.5 | 13 | 8 | 1023.4 | 93.0 | 9.3 | 0 | 0 | 0 | 0 | 0 | 0 | 14 |
| 15 | 11.5 | 7.5 | 4.5 | 11.0 | 5.9 | 0.0 | E | 3.0 | 14 | 8 | 1018.9 | 89.6 | 8.2 | 0 | 0 | 0 | 0 | 0 | 0 | 15 |
| 16 | 10.7 | 5.6 | 5.0 | 10.3 | 4.1 | 0.0 | NE | 2.9 | 17 | 8 | 1017.1 | 91.2 | 6.7 | 1 | 0 | 0 | 0 | 0 | 0 | 16 |
| 17 | 12.8 | 5.9 | 5.7 | 10.0 | 3.9 | 0.0 | S | 6.5 | 17 | 8 | 1017.6 | 92.0 | 9.7 | 0 | 0 | 0 | 0 | 0 | 0 | 17 |
| 18 | 13.7 | 7.0 | 5.1 | 9.7 | 5.5 | 0.0 | S | 5.4 | 19 | 1 | 1017.3 | 91.5 | 9.6 | 0 | 0 | 0 | 0 | 0 | 0 | 18 |
| 19 | 12.5 | 6.3 | 3.5 | 9.4 | 7.5 | 0.0 | E | 3.4 | 16 | 0 | 1016.7 | 92.1 | 8.0 | 0 | 0 | 0 | 0 | 0 | 0 | 19 |
| 20 | 11.5 | 4.1 | 0.4 | 8.7 | 6.9 | 0.0 | SE | 3.7 | 17 | 0 | 1018.3 | 92.6 | 7.6 | 0 | 0 | 0 | 0 | 0 | 0 | 20 |
| 21 | 10.8 | 6.5 | 5.6 | 8.4 | 0.6 | 0.5 | SE | 5.0 | 16 | 8 | 1014.9 | 94.4 | 8.5 | 1 | 0 | 0 | 0 | 0 | 0 | 21 |
| 22 | 12.0 | 8.5 | 8.1 | 9.0 | 0.0 | 0.2 | S | 3.1 | 11 | 8 | 1018.2 | 97.0 | 9.6 | 1 | 0 | 0 | 0 | 0 | 0 | 22 |
| 23 | 9.4 | 3.8 | -0.1 | 9.0 | 3.0 | 0.0 | SW | 7.0 | 22 | 4 | 1026.0 | 91.8 | 6.8 | 0 | 0 | 0 | 0 | 0 | 0 | 23 |
| 24 | 12.8 | 7.6 | 6.3 | 8.7 | 2.6 | 0.2 | S | 9.9 | 29 | 5 | 1025.5 | 91.0 | 9.5 | 0 | 0 | 0 | 0 | 0 | 0 | 24 |
| 25 | 11.3 | 9.0 | 6.9 | 9.0 | 6.8 | 0.0 | W | 11.2 | 32 | 0 | 1022.9 | 81.9 | 9.8 | 0 | 0 | 0 | 0 | 0 | 0 | 25 |
| 26 | 13.4 | 6.4 | 4.5 | 8.5 | 0.7 | TR | SW | 13.5 | 37 | 7 | 1023.4 | 83.1 | 9.6 | 0 | 0 | 0 | 0 | 0 | 0 | 26 |
| 27 | 13.0 | 10.1 | 8.6 | 9.0 | 5.5 | TR | W | 12.2 | 40 | 3 | 1019.5 | 74.9 | 9.8 | 0 | 0 | 0 | 0 | 0 | 0 | 27 |
| 28 | 12.6 | 1.6 | -0.9 | 8.0 | 0.3 | TR | S | 6.8 | 23 | 7 | 1021.5 | 84.6 | 6.2 | 0 | 0 | 0 | 0 | 0 | 0 | 28 |
| 29 | 13.0 | 10.5 | 8.5 | 9.9 | 0.2 | 2.2 | S | 13.7 | 40 | 8 | 1007.7 | 83.8 | 10.9 | 0 | 0 | 0 | 0 | 0 | 0 | 29 |
| 30 | 11.4 | 4.5 | 2.9 | 8.4 | 6.4 | 1.7 | S | 10.5 | 27 | 1 | 1017.7 | 81.2 | 7.9 | 0 | 0 | 0 | 0 | 0 | 0 | 30 |
| Total/Mean | 12.7 | 7.9 | 6.3 | 10.3 | 85.8 | 30.7 | X | 5.9 | X | 6.0 | 1016.5 | 90.2 | 9.8 | 5 | 0 | 0 | 0 | 0 | 0 | Total/Mean |
| *Diff./% | +2.8 | +2.9 | 126% | 54% | *Diff./% | |||||||||||||||
| Date | Max. Temp. (°C) 09/09h | Min. Temp. (°C) 09/09h | Grass Min. Temp. (°C) 21/09h | Earth (30cms) Temp. (°C) 09h | Sun (Hours) 00/00h | R'fall (MM) 09/09h | Wind Dir'n 09h | Mean Wind Speed (MPH) 00/00h | Max. Gust Speed (MPH) 00/00h | Cloud Cover (Oktas) 09h | Mean MSL Air Pressure (mB) 00/00h | Mean Rel. Humd. (%) 00/00h | Mean Temp. (°C) 00/00h | Fog (vis. <1000m @ 09h) | Fog (vis. <200m @ 09h) | Snow or Rain and Snow 00/00h | Snow Lying @ 09h (>50% cover) | Hail 00/00h | Thunder 00/00h | Date |
Differences from average:
Differences from average shown in red. Reference periods used are as follows: Temperature 30 Years 1976/2005; rainfall 30 Years 1971/2000; sunshine 30 Years 1971/2000.
(*The differences from average quoted during the course of the month relate to the cumulative daily averages up to the date of the last observation, not the averages for the month as a whole)
Additional Data:
Rainfall Duration N/A
Air Frost Duration NIL hours
Graphs and Charts:
Click on the following links to view this month's graphs and charts.....
1. Daily Maximum, Minimum & Grass Minimum Temperatures
2. Daily Maximum & Minimum Temperatures (with 30 Year Comparative Means)
3. Daily Earth (30 cms Depth) Temperature @ 0900 GMT 4. Daily Rainfall 5. Daily Sunshine
6. Daily Maximum Gust & Mean Wind Speed 7. Daily Wind Direction @ 0900 GMT
8. Daily Mean MSL Air Pressure 9. Daily Mean Relative Humidity 10. Thermograph
11. Barograph 12. Hygrograph 13. Anemograph 14. Wind Direction
15. Rainfall Intensity & Duration
November 2011 Weather Review:
......and click on the link below for a text report of the November 2011 weather in Royston
November (since 1972) at Royston (Iceni) Weather Station:
Mean day maximum temperature (30 years 1981/2010) 9.9°C
Mean night minimum temperature (30 years 1981/2010) 5.0°C
Highest temperature 17.8°C (2nd November 1984); lowest temperature -7.1C (28th November 2010)
Lowest grass minimum temperature -10.5°C (30th November 1978, 28th November 2010)
Warmest November 1994 (Mean temperature 10.5°C); coldest November 1985 (Mean temperature 4.2°C)
Average November rainfall (30 years 1981/2010) 57.1 mm
Wettest November 2000 (Rainfall 118.2 mm); driest November 1978 (Rainfall 17.2 mm)
Wettest Day 18th November 2004 (Rainfall 28.3 mm)
Highest number of "rain days" (0.2 mm or more) 24 (2009); lowest number of "rain days" 7 (1978)
Highest number of days with thunder 2 (1974)
Highest number of air frosts 10 (1985, 1996)
Highest number of ground frosts 17 (1985, 1988)
Highest number of days with snow falling 4 (1980, 1985, 2010)
Highest number of days with snow lying (ground with more than 50% snow cover @ 0900 GMT) 5 (1988)
|
|
|
|
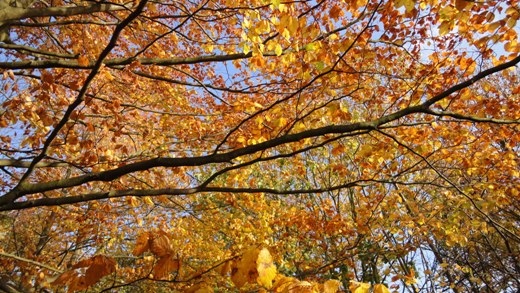
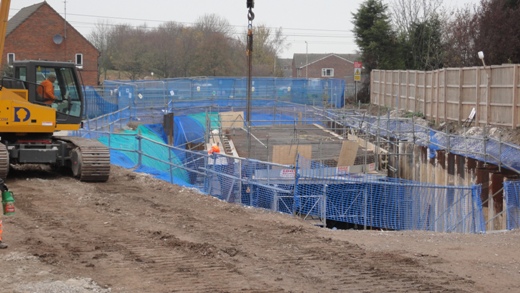
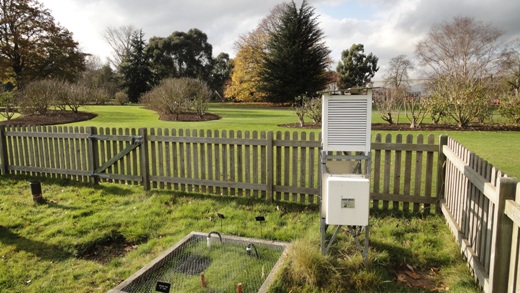
| With the underlying rock at Royston being chalk (which is close to the surface in most places) many species of plants and trees will not grow but this does not include the beech tree which drives its roots directly into solid chalk and thrives in abundance in the town. Many of the the beech trees around Royston are mature and very large but along the Icknield Way to the east of the town a new plantation was set almost 40 years ago and the included beech trees are still relatively small compared with the fully grown mature specimens in the district. The beech trees have once again provided a splendid display of Autumn colour this year as demonstrated by one of the younger beeches along the Icknield Way pictured above (at 0827 GMT on 2nd November 2011). The early morning sunshine illuminating the leaves contributed to a total sunshine for the day of 6.3 hours, whilst a SSE wind of mean speed 4 knots gusting to 16 knots in a temperature of 10.2°C gives an indication of the main meteorological conditions at the time. | The preparatory work for the railway underpass between Coombes Hole and Burns Road in Royston is proceeding apace ready for the scheduled railway engineering possession at Christmas 2011 for the line to be breached and the underpass installed. The above picture (taken at 1105 GMT on 14th November 2011) shows the structure of the underpass being constructed in a very deep excavation adjacent to the railway line ready to be manoeuvred into position once the chalk underneath the track has been dug out. A very tight timescale for this major operation will be in force so that the railway line can be reinstated in time for the end of the holiday period. The whole project so far has been facilitated by the dry weather which has predominated since early this year, the main weather induced problem appearing to be the raising of dust which has required frequent spraying to minimise the effects of this consequence. The day of this photograph was dry too, but unusually for recent months was completely sunless. | This is the meteorological enclosure at the Royal Botanic Gardens at Kew (67 km SSW of Royston) as seen at 1247 GMT on 17th November 2011. The equipment on view (and some to the left just out of the picture) is a combination of manual and automatic instruments, the Stevenson Screen and associated automatic recording/transmission apparatus being prominent on the right. Various earth thermometers and rain gauges are housed in this enclosure, whilst the station's wind measuring instruments are located remotely on a building elsewhere in the gardens. This site achieved headline status on 10th August 2003 when a maximum temperature of 38.1°C was recorded, eclipsed only marginally by the UK temperature record of 38.5°C set at Brogdale near Faversham in Kent on the same date. This date was also responsible for the highest temperature (36.4°C) ever recorded (since 1972) at Royston (Iceni) Weather Station. The Royston maximum temperature could have been slightly higher but for the arrival of cloud over the sun just at the hottest part of the day! |
Return to Welcome to Royston (Iceni) Weather Station page
(This page last updated 10th December 2011 2104 GMT)