Royston (Iceni) Weather Station
Daily Weather Observations - August 2011
(All Times GMT)
| Date | Max. Temp. (°C) 09/09h | Min. Temp. (°C) 09/09h | Grass Min. Temp. (°C) 21/09h | Earth (30cms) Temp. (°C) 09h | Sun (Hours) 00/00h | R'fall (MM) 09/09h | Wind Dir'n 09h | Mean Wind Speed (MPH) 00/00h | Max. Gust Speed (MPH) 00/00h | Cloud Cover (Oktas) 09h | Mean MSL Air Pressure (mB) 00/00h | Mean Rel. Humd. (%) 00/00h | Mean Temp. (°C) 00/00h | Fog (vis. <1000m @ 09h) | Fog (vis. <200m @ 09h) | Snow or Rain and Snow 00/00h | Snow Lying @ 09h (>50% cover) | Hail 00/00h | Thunder 00/00h | Date |
| 1 | 26.9 | 14.0 | 12.8 | 18.8 | 4.9 | 0.2 | SE | 5.0 | 19 | 8 | 1012.7 | 60.3 | 20.2 | 0 | 0 | 0 | 0 | 0 | 0 | 1 |
| 2 | 28.7 | 16.0 | 13.6 | 19.0 | 5.8 | 0.4 | S | 3.5 | 17 | 4 | 1013.5 | 70.3 | 21.1 | 0 | 0 | 0 | 0 | 0 | 0 | 2 |
| 3 | 29.8 | 16.0 | 13.0 | 19.8 | 9.3 | 1.7 | W | 3.5 | 18 | 2 | 1013.4 | 67.8 | 22.1 | 0 | 0 | 0 | 0 | 0 | 1 | 3 |
| 4 | 20.0 | 15.6 | 14.2 | 20.4 | 0.1 | 4.5 | S | 7.8 | 33 | 8 | 1009.1 | 90.7 | 17.3 | 0 | 0 | 0 | 0 | 0 | 0 | 4 |
| 5 | 24.5 | 13.9 | 12.4 | 18.9 | 4.9 | 0.0 | NW | 4.5 | 19 | 6 | 1010.3 | 75.2 | 18.7 | 0 | 0 | 0 | 0 | 0 | 0 | 5 |
| 6 | 20.2 | 14.0 | 13.0 | 19.0 | 1.8 | TR | S | 7.0 | 21 | 8 | 1002.5 | 73.1 | 16.5 | 0 | 0 | 0 | 0 | 0 | 0 | 6 |
| 7 | 18.9 | 11.7 | 10.1 | 18.4 | 6.4 | 0.8 | SW | 9.1 | 30 | 3 | 1001.3 | 77.8 | 14.7 | 0 | 0 | 0 | 0 | 0 | 0 | 7 |
| 8 | 21.7 | 10.1 | 6.8 | 17.6 | 7.3 | 0.0 | W | 10.0 | 32 | 3 | 1006.3 | 71.2 | 15.6 | 0 | 0 | 0 | 0 | 0 | 0 | 8 |
| 9 | 22.5 | 11.0 | 9.6 | 17.7 | 9.8 | 0.0 | NW | 6.3 | 21 | 5 | 1021.0 | 63.1 | 15.4 | 0 | 0 | 0 | 0 | 0 | 0 | 9 |
| 10 | 24.1 | 10.0 | 6.6 | 17.9 | 5.4 | TR | SW | 9.5 | 31 | 5 | 1019.6 | 63.7 | 16.9 | 0 | 0 | 0 | 0 | 0 | 0 | 10 |
| 11 | 23.1 | 14.0 | 12.8 | 18.2 | 2.3 | 0.8 | SW | 9.7 | 28 | 7 | 1009.2 | 77.6 | 17.7 | 0 | 0 | 0 | 0 | 0 | 0 | 11 |
| 12 | 21.1 | 15.0 | 13.4 | 18.1 | 0.4 | 4.4 | W | 3.4 | 14 | 8 | 1009.5 | 85.2 | 17.7 | 0 | 0 | 0 | 0 | 0 | 0 | 12 |
| 13 | 21.3 | 15.0 | 14.0 | 18.0 | 2.2 | 0.0 | SW | 6.9 | 23 | 8 | 1005.1 | 82.5 | 17.4 | 0 | 0 | 0 | 0 | 0 | 0 | 13 |
| 14 | 22.7 | 13.5 | 11.5 | 18.0 | 3.5 | 0.0 | SW | 5.3 | 17 | 7 | 1006.3 | 70.3 | 17.3 | 0 | 0 | 0 | 0 | 0 | 0 | 14 |
| 15 | 23.3 | 11.0 | 7.5 | 18.0 | 7.9 | TR | W | 6.3 | 22 | 1 | 1015.0 | 64.1 | 16.7 | 0 | 0 | 0 | 0 | 0 | 0 | 15 |
| 16 | 21.5 | 12.7 | 11.0 | 18.3 | 2.9 | 0.0 | SW | 8.2 | 27 | 8 | 1014.9 | 75.6 | 17.2 | 0 | 0 | 0 | 0 | 0 | 0 | 16 |
| 17 | 19.8 | 11.7 | 8.4 | 18.0 | 1.7 | 1.1 | NE | 1.6 | 12 | 7 | 1017.1 | 73.8 | 14.9 | 0 | 0 | 0 | 0 | 0 | 0 | 17 |
| 18 | 14.1 | 9.0 | 6.2 | 17.5 | 0.1 | 10.6 | NE | 2.3 | 17 | 8 | 1015.6 | 93.8 | 11.8 | 0 | 0 | 0 | 0 | 0 | 0 | 18 |
| 19 | 22.3 | 8.7 | 6.0 | 16.3 | 11.5 | 0.0 | W | 5.9 | 19 | 1 | 1017.7 | 76.6 | 15.3 | 0 | 0 | 0 | 0 | 0 | 0 | 19 |
| 20 | 22.2 | 12.6 | 11.0 | 17.0 | 8.0 | 0.1 | SW | 5.8 | 21 | 3 | 1017.4 | 82.1 | 16.5 | 0 | 0 | 0 | 0 | 0 | 0 | 20 |
| 21 | 23.7 | 12.7 | 10.3 | 17.1 | 6.3 | 0.0 | NW | 5.0 | 21 | 6 | 1013.3 | 71.5 | 18.3 | 0 | 0 | 0 | 0 | 0 | 0 | 21 |
| 22 | 23.7 | 11.0 | 7.4 | 17.2 | 9.2 | 0.2 | N | 2.2 | 15 | 2 | 1018.4 | 71.0 | 16.8 | 0 | 0 | 0 | 0 | 0 | 0 | 22 |
| 23 | 15.5 | 13.2 | 9.8 | 17.6 | 0.0 | 1.5 | NE | 2.7 | 13 | 8 | 1013.1 | 93.7 | 14.1 | 0 | 0 | 0 | 0 | 0 | 0 | 23 |
| 24 | 21.6 | 13.1 | 10.0 | 16.9 | 4.3 | 0.3 | SW | 5.7 | 19 | 8 | 1012.3 | 79.5 | 16.2 | 0 | 0 | 0 | 0 | 0 | 0 | 24 |
| 25 | 19.8 | 12.9 | 11.4 | 16.8 | 4.2 | 7.8 | SW | 5.7 | 22 | 7 | 1009.2 | 80.6 | 15.3 | 0 | 0 | 0 | 0 | 0 | 0 | 25 |
| 26 | 15.5 | 12.3 | 12.0 | 16.8 | 0.1 | 10.0 | NE | 2.1 | 15 | 8 | 1004.1 | 96.0 | 13.3 | 0 | 0 | 0 | 0 | 0 | 0 | 26 |
| 27 | 18.9 | 10.9 | 8.0 | 16.1 | 4.7 | 3.7 | W | 6.6 | 33 | 6 | 1011.3 | 86.7 | 13.5 | 0 | 0 | 0 | 0 | 0 | 0 | 27 |
| 28 | 19.7 | 11.4 | 9.9 | 16.0 | 5.7 | 2.6 | W | 7.3 | 23 | 8 | 1014.4 | 81.1 | 14.0 | 0 | 0 | 0 | 0 | 0 | 0 | 28 |
| 29 | 15.5 | 9.9 | 8.1 | 16.0 | 2.2 | TR | W | 7.4 | 25 | 6 | 1016.5 | 76.4 | 12.8 | 0 | 0 | 0 | 0 | 0 | 0 | 29 |
| 30 | 16.2 | 10.8 | 9.2 | 15.7 | 0.1 | 0.0 | W | 4.5 | 15 | 8 | 1016.3 | 80.1 | 13.6 | 0 | 0 | 0 | 0 | 0 | 0 | 30 |
| 31 | 17.4 | 12.0 | 11.3 | 15.8 | 0.9 | 0.0 | W | 1.4 | 10 | 8 | 1015.5 | 76.9 | 14.1 | 0 | 0 | 0 | 0 | 0 | 0 | 31 |
| Total/Mean | 21.2 | 12.4 | 10.4 | 17.6 | 133.6 | 50.7 | X | 5.6 | X | 6.0 | 1012.3 | 77.0 | 16.2 | 0 | 0 | 0 | 0 | 0 | 1 | Total/Mean |
| *Diff./% | -1.2 | -0.5 | 71% | 90% | *Diff./% | |||||||||||||||
| Date | Max. Temp. (°C) 09/09h | Min. Temp. (°C) 09/09h | Grass Min. Temp. (°C) 21/09h | Earth (30cms) Temp. (°C) 09h | Sun (Hours) 00/00h | R'fall (MM) 09/09h | Wind Dir'n 09h | Mean Wind Speed (MPH) 00/00h | Max. Gust Speed (MPH) 00/00h | Cloud Cover (Oktas) 09h | Mean MSL Air Pressure (mB) 00/00h | Mean Rel. Humd. (%) 00/00h | Mean Temp. (°C) 00/00h | Fog (vis. <1000m @ 09h) | Fog (vis. <200m @ 09h) | Snow or Rain and Snow 00/00h | Snow Lying @ 09h (>50% cover) | Hail 00/00h | Thunder 00/00h | Date |
Differences from average:
Differences from average shown in red. Reference periods used are as follows: Temperature 30 Years 1976/2005; rainfall 30 Years 1971/2000; sunshine 30 Years 1971/2000.
(*The differences from average quoted during the course of the month relate to the cumulative daily averages up to the date of the last observation, not the averages for the month as a whole)
Additional Data:
Rainfall Duration N/A
Air Frost Duration NIL hours
Graphs and Charts:
Click on the following links to view this month's graphs and charts.....
1. Daily Maximum, Minimum & Grass Minimum Temperatures
2. Daily Maximum & Minimum Temperatures (with 30 Year Comparative Means)
3. Daily Earth (30 cms Depth) Temperature @ 0900 GMT 4. Daily Rainfall 5. Daily Sunshine
6. Daily Maximum Gust & Mean Wind Speed 7. Daily Wind Direction @ 0900 GMT
8. Daily Mean MSL Air Pressure 9. Daily Mean Relative Humidity 10. Thermograph
11. Barograph 12. Hygrograph 13. Anemograph 14. Wind Direction
15. Rainfall Intensity & Duration
August 2011 Weather Review:
......and click on the link below for a text report of the August 2011 weather in Royston
August (since 1972) at Royston (Iceni) Weather Station:
Mean day maximum temperature (30 years 1981/2010) 22.4°C
Mean night minimum temperature (30 years 1981/2010) 12.9°C
Highest temperature 36.4°C (10th August 2003); lowest temperature 5.1°C (23rd August1993)
Lowest grass minimum temperature 1.0°C (23rd August1993)
Hottest August 1997 (Mean temperature 20.9°C); coolest August 1986 (Mean temperature 14.9°C)
Average August rainfall (30 years 1981/2010) 56.1 mm
Wettest August 2010 (Rainfall 149.3 mm); driest August 2003 (Rainfall 0.7 mm)
Wettest Day 6th August 2009 (Rainfall 52.4 mm)
Highest number of "rain days" (0.2 mm or more) 20 (2010); lowest number of "rain days" 1 (2003)
Highest number of days with thunder 6 (1999)
|
|
|
|
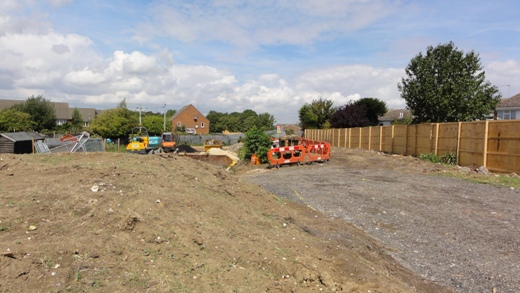
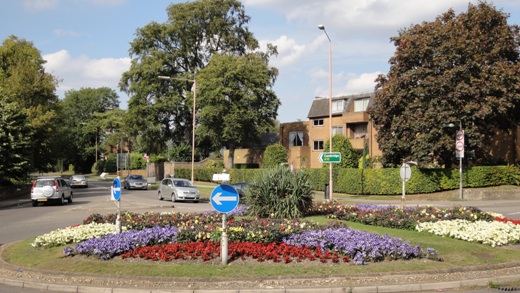
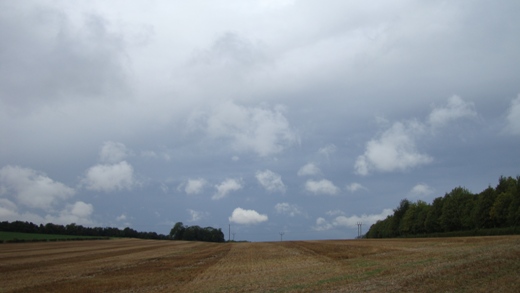
| Preparatory work for the new rail underpass linking Coombes Hole with Burns Road in the northern part of Royston has continued apace through the month of August, this being the scene looking north-westwards along Coombes Hole towards the railway line on 5th August 2011 at 1101 GMT. Part of the Green Street allotment site has been taken over temporarily to facilitate construction of the underpass and in the left foreground of this picture is the heap of topsoil which has been removed for the duration of the work, and now awaits completion of the project before being reinstated to its former location. Temporary fencing has been installed along Coombes Hole (as shown) to shield the adjacent housing area. The weather conditions at this time consisted of a westerly breeze of mean speed 2 knots gusting to 7 knots in a temperature of 20.5°C. Although sunny at this time the total sunshine for the day was only 4.9 hours, but the temperature peaked at a slightly (+0.8°C) above average 24.5°C. | The Town Hall roundabout to the east of Royston Town Centre has featured in these pages several times previously showing the flower displays which are virtually an all year round attraction. Summer 2011 has been no exception and here the roundabout is viewed from its southern side at 1535 GMT on 19th August 2011. Melbourn Street and the Town Hall itself are westwards to the immediate left, whilst Newmarket Road runs off eastwards to the right and Melbourn Road northwards through the trees at the top left of the picture. A famous Royston landmark used to be the Priory cinema on a prominent site bordering the roundabout to the right, but this was demolished in the last decade, having previously being destroyed by fire in 1933 and later rebuilt. At the time this picture was taken the temperature was 20.7°C, relative humidity 56%, wind direction SW, and mean wind speed 7 knots gusting to 12 knots. The day was the sunniest of the month to date with sunshine of 11.5 hours. | 0n 25th August 2011 a little early morning rain in Royston was followed by a brief brighter interlude before a further area of rain moved in from the south-west giving mainly light rain for a 2 hour period from approximately 0900 to 1100 GMT. In this picture the cloud responsible for this rainfall is seen approaching Royston at 0823 GMT and looks rather more ominous than the subsequent precipitation it actually produced. The terrain featured in the picture is farmland on the Burloes estate on the eastern side of the town, the crop of oats in this field having been harvested earlier in the month. Just visible to the left of the resultant stubble is an area of sugar beet on land bordered by the Barkway Road, Barley Road and Cow Plantation. The temperature is a rather cool 13.0°C in a SSW wind of mean speed 8 knots gusting to 13 knots. The temperature later rose to a maximum of 19.8°C which is 1.6°C below the 30 Year (1981/2010) average maximum for this day. |
Return to Welcome to Royston (Iceni) Weather Station page
(This page last updated 12th September 2011 2010 GMT)