
Royston (Iceni) Weather Station
Daily Weather Observations - November 2010
(All Times GMT)
| Date | Max. Temp. (°C) 09/09h | Min. Temp. (°C) 09/09h | Grass Min. Temp. (°C) 21/09h | Earth (30cms) Temp. (°C) 09h | Sun (Hours) 00/00h | R'fall (MM) 09/09h | Wind Dir'n 09h | Mean Wind Speed (MPH) 00/00h | Max. Gust Speed (MPH) 00/00h | Cloud Cover (Oktas) 09h | Mean MSL Air Pressure (mB) 00/00h | Mean Rel. Humd. (%) 00/00h | Mean Temp. (°C) 00/00h | Fog (vis. <1000m @ 09h) | Fog (vis. <200m @ 09h) | Snow or Rain and Snow 00/00h | Snow Lying @ 09h (>50% cover) | Hail 00/00h | Thunder 00/00h | Date |
| 1 | 12.1 | 7.6 | 3.5 | 10.1 | 0.9 | 0.3 | NW | 5.0 | 23 | 8 | 1012.4 | 93.1 | 9.4 | 0 | 0 | 0 | 0 | 0 | 0 | 1 |
| 2 | 14.1 | 9.8 | 8.8 | 10.3 | 0.1 | 0.2 | SW | 12.8 | 33 | 8 | 1007.3 | 82.1 | 12.4 | 0 | 0 | 0 | 0 | 0 | 0 | 2 |
| 3 | 15.5 | 9.9 | 6.1 | 10.7 | 3.6 | 0.1 | W | 10.7 | 33 | 2 | 1009.6 | 78.3 | 13.5 | 0 | 0 | 0 | 0 | 0 | 0 | 3 |
| 4 | 17.2 | 14.2 | 12.8 | 11.0 | 1.6 | 0.0 | SW | 16.3 | 36 | 7 | 1014.8 | 78.8 | 15.8 | 0 | 0 | 0 | 0 | 0 | 0 | 4 |
| 5 | 15.6 | 14.8 | 13.6 | 11.9 | 0.0 | 14.1 | SW | 8.0 | 33 | 8 | 1017.0 | 86.8 | 13.3 | 0 | 0 | 0 | 0 | 0 | 0 | 5 |
| 6 | 10.0 | 6.5 | 3.5 | 11.6 | 6.0 | TR | NW | 3.7 | 15 | 1 | 1014.6 | 87.9 | 6.9 | 0 | 0 | 0 | 0 | 0 | 0 | 6 |
| 7 | 9.1 | 0.8 | -2.0 | 10.0 | 4.2 | 1.4 | NW | 2.0 | 17 | 7 | 1005.3 | 86.6 | 4.0 | 0 | 0 | 0 | 0 | 0 | 0 | 7 |
| 8 | 6.6 | 2.7 | 0.9 | 9.0 | 0.0 | 5.8 | SE | 7.9 | 35 | 8 | 973.0 | 88.9 | 4.7 | 0 | 0 | 0 | 0 | 0 | 0 | 8 |
| 9 | 7.7 | 4.5 | 2.9 | 8.7 | 0.0 | 0.7 | NE | 7.3 | 25 | 8 | 978.1 | 88.4 | 5.9 | 0 | 0 | 0 | 0 | 0 | 0 | 9 |
| 10 | 9.0 | 1.5 | -1.5 | 8.5 | 4.0 | 2.5 | NW | 6.7 | 24 | 8 | 997.5 | 79.9 | 3.6 | 0 | 0 | 0 | 0 | 0 | 0 | 10 |
| 11 | 13.5 | 1.0 | -1.0 | 7.6 | 0.8 | 0.9 | S | 15.9 | 46 | 8 | 987.6 | 80.0 | 8.1 | 0 | 0 | 0 | 0 | 0 | 0 | 11 |
| 12 | 12.1 | 9.0 | 7.0 | 8.2 | 3.1 | 0.6 | SW | 14.1 | 37 | 1 | 990.0 | 77.2 | 9.8 | 0 | 0 | 0 | 0 | 0 | 0 | 12 |
| 13 | 9.8 | 8.1 | 6.4 | 8.5 | 0.8 | 1.0 | SW | 7.1 | 22 | 6 | 992.2 | 83.9 | 8.2 | 0 | 0 | 0 | 0 | 0 | 0 | 13 |
| 14 | 7.2 | 4.4 | -0.3 | 8.4 | 0.5 | 1.1 | W | 4.4 | 20 | 6 | 995.1 | 90.9 | 6.0 | 0 | 0 | 0 | 0 | 0 | 0 | 14 |
| 15 | 7.1 | 1.7 | -2.5 | 7.8 | 5.7 | 0.0 | SW | 3.1 | 13 | 3 | 1013.1 | 89.4 | 3.8 | 0 | 0 | 0 | 0 | 0 | 0 | 15 |
| 16 | 8.7 | 2.2 | -1.0 | 6.8 | 7.4 | 0.1 | NW | 4.7 | 18 | 0 | 1019.0 | 90.5 | 4.8 | 0 | 0 | 0 | 0 | 0 | 0 | 16 |
| 17 | 5.8 | 4.6 | 2.1 | 6.5 | 0.0 | 0.7 | SE | 6.1 | 23 | 8 | 1007.7 | 86.2 | 5.2 | 0 | 0 | 0 | 0 | 0 | 0 | 17 |
| 18 | 9.4 | 4.4 | 3.0 | 6.9 | 1.2 | 0.3 | SE | 5.2 | 18 | 6 | 1004.6 | 89.3 | 6.7 | 0 | 0 | 0 | 0 | 0 | 0 | 18 |
| 19 | 9.0 | 3.5 | 0.9 | 7.3 | 6.5 | TR | SW | 3.2 | 13 | 0 | 1010.8 | 92.5 | 4.9 | 0 | 0 | 0 | 0 | 0 | 0 | 19 |
| 20 | 5.7 | 0.5 | -2.3 | 6.7 | 0.0 | 0.2 | SE | 1.6 | 10 | 8 | 1013.6 | 94.8 | 4.0 | 1 | 0 | 0 | 0 | 0 | 0 | 20 |
| 21 | 6.5 | 4.8 | 4.9 | 7.0 | 0.1 | 0.4 | NE | 3.1 | 15 | 8 | 1011.3 | 94.4 | 5.5 | 0 | 0 | 0 | 0 | 0 | 0 | 21 |
| 22 | 6.6 | 2.3 | -1.4 | 7.1 | 0.0 | 0.3 | NE | 1.6 | 12 | 8 | 1009.5 | 93.7 | 4.6 | 0 | 0 | 0 | 0 | 0 | 0 | 22 |
| 23 | 6.1 | 3.5 | 1.5 | 7.0 | 0.3 | 0.0 | NW | 5.2 | 20 | 6 | 1010.7 | 88.8 | 4.6 | 0 | 0 | 0 | 0 | 0 | 0 | 23 |
| 24 | 3.8 | -1.0 | -3.6 | 6.7 | 4.2 | 0.3 | W | 5.7 | 15 | 2 | 1009.2 | 86.1 | 1.8 | 0 | 0 | 0 | 0 | 0 | 0 | 24 |
| 25 | 1.4 | -1.4 | -3.8 | 6.0 | 0.9 | 0.0 | NW | 5.4 | 17 | 5 | 1007.4 | 87.3 | 0.4 | 0 | 0 | 1 | 0 | 0 | 0 | 25 |
| 26 | 1.7 | -3.5 | -7.1 | 5.4 | 5.9 | 0.2 | W | 4.1 | 13 | 1 | 1005.8 | 86.3 | -1.7 | 0 | 0 | 0 | 0 | 0 | 0 | 26 |
| 27 | 1.0 | -3.5 | -7.8 | 4.5 | 1.4 | 0.0 | S | 3.6 | 15 | 8 | 1003.3 | 89.7 | -1.8 | 0 | 0 | 1 | 1 | 0 | 0 | 27 |
| 28 | -1.0 | -7.1 | -10.5 | 4.0 | 5.5 | TR | W | 2.3 | 8 | 3 | 1005.8 | 88.3 | -3.7 | 0 | 0 | 0 | 0 | 0 | 0 | 28 |
| 29 | 0.7 | -4.0 | -8.6 | 3.6 | 0.2 | 2.9 | N | 3.1 | 17 | 8 | 1011.1 | 91.5 | -1.3 | 1 | 0 | 1 | 0 | 0 | 0 | 29 |
| 30 | 1.0 | -0.6 | -1.9 | 3.5 | 1.2 | TR | NE | 5.7 | 19 | 8 | 1012.8 | 89.9 | -0.3 | 0 | 0 | 1 | 1 | 0 | 0 | 30 |
| Total/Mean | 7.8 | 3.4 | 0.8 | 7.7 | 66.1 | 34.1 | X | 6.2 | X | 5.6 | 1005.0 | 87.4 | 5.3 | 2 | 0 | 4 | 2 | 0 | 0 | Total/Mean |
| *Diff./% | -1.9 | -1.5 | 97% | 65% | *Diff./% | |||||||||||||||
| Date | Max. Temp. (°C) 09/09h | Min. Temp. (°C) 09/09h | Grass Min. Temp. (°C) 21/09h | Earth (30cms) Temp. (°C) 09h | Sun (Hours) 00/00h | R'fall (MM) 09/09h | Wind Dir'n 09h | Mean Wind Speed (MPH) 00/00h | Max. Gust Speed (MPH) 00/00h | Cloud Cover (Oktas) 09h | Mean MSL Air Pressure (mB) 00/00h | Mean Rel. Humd. (%) 00/00h | Mean Temp. (°C) 00/00h | Fog (vis. <1000m @ 09h) | Fog (vis. <200m @ 09h) | Snow or Rain and Snow 00/00h | Snow Lying @ 09h (>50% cover) | Hail 00/00h | Thunder 00/00h | Date |
Differences from average:
Differences from average shown in red. Reference periods used are as follows: Temperature 30 Years 1976/2005; rainfall 30 Years 1971/2000; sunshine 30 Years 1971/2000.
(*The differences from average quoted during the course of the month relate to the cumulative daily averages up to the date of the last observation, not the averages for the month as a whole)
Additional Data:
Rainfall Duration N/A
Air Frost Duration 108.8 hours
Graphs and Charts:
Click on the following links to view this month's graphs and charts.....
1. Daily Maximum, Minimum & Grass Minimum Temperatures
2. Daily Maximum & Minimum Temperatures (with 30 Year Comparative Means)
3. Daily Earth (30 cms Depth) Temperature @ 0900 GMT 4. Daily Rainfall 5. Daily Sunshine
6. Daily Maximum Gust & Mean Wind Speed 7. Daily Wind Direction @ 0900 GMT
8. Daily Mean MSL Air Pressure 9. Daily Mean Relative Humidity 10. Thermograph
11. Barograph 12. Hygrograph 13. Anemograph 14. Wind Direction
15. Rainfall Intensity & Duration
November 2010 Weather Review:
......and click on the link below for a text report of the November 2010 weather in Royston
November (since 1972) at Royston (Iceni) Weather Station:
Mean day maximum temperature (30 years 1976/2005) 9.7°C
Mean night minimum temperature (30 years 1976/2005) 4.9°C
Highest temperature 17.8°C (2nd November 1984); lowest temperature -6.9°C (30th November 1978)
Lowest grass minimum temperature -10.5°C (30th November 1978)
Warmest November 1994 (Mean temperature 10.5°C); coldest November 1985 (Mean temperature 4.2°C)
Average November rainfall (30 years 1971/2000) 52.4 mm
Wettest November 2000 (Rainfall 118.2 mm); driest November 1978 (Rainfall 17.2 mm)
Wettest Day 18th November 2004 (Rainfall 28.3 mm)
Highest number of "rain days" (0.2 mm or more) 24 (2009); lowest number of "rain days" 7 (1978)
Highest number of days with thunder 2 (1974)
Highest number of air frosts 10 (1985, 1996)
Highest number of ground frosts 17 (1985, 1988)
Highest number of days with snow falling 4 (1980, 1985)
Highest number of days with snow lying (ground with more than 50% snow cover @ 0900 GMT) 5 (1988)
|
|
|
|
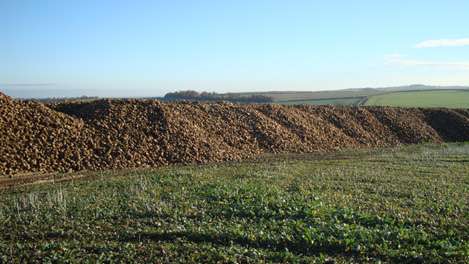
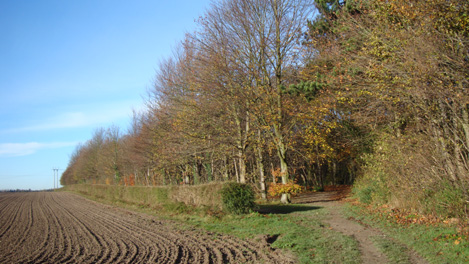
| The sugar beet campaign is in full swing and this mound of beet close to Poor's Land mid-way between Royston and Barley has just been lifted from fields nearby and awaits transportation to an East Anglian processing plant. This picture was taken on 6th November 2010 at 0843 GMT and is looking eastwards towards Wardington Bottom. The bridleway which runs from the black barn on the B1039 road to Barley is on the other side of the line of the beet mound and parallel to it. At the time a WNW wind of mean speed 4 knots gusting to 9 knots was in evidence and the temperature was 6.8°C. A pleasant Autumn day ensued with a maximum temperature of 10.0°C (after an overnight minimum of 6.5°C) and sunshine of 6.0 hours. | Just two weeks before this photograph was taken (on 15th November 2010 at 0924 GMT) this plantation on the Burloes estate to the east of Royston was a blaze of Autumn colour, but has now taken on its Winter mantle. The plantation was set in the early 1970's and despite being fully exposed to the notorious southerly gale of 16th October 1987 it managed to survive intact. However, an adjacent mature plantation just a few metres to the right of this scene was devastated in the gale and only the stronger trees around its perimeter remained upright. This plantation was re-set soon afterwards and has shown considerable re-growth in the meantime. Sunshine of 5.7 hours was recorded on this day, with a maximum temperature of 7.1°C. | This is the High Street in Royston on 19th November 2010 at 1048 GMT looking northwards towards the Cross and the intersection with the Icknield Way (old A505). This street is on the line of the old Roman Road Ermine Street and originally carried the north-south traffic through the town until a diversion was created to the east side of the Priory Memorial Gardens in the middle of the last century. The A10 road south of Royston to London follows the alignment of Ermine Street, whilst to the north Ermine Street is now the A1198 as far as Godmanchester, and proceeds 6 miles from Royston to Arrington and then onwards to Lincoln and York Angel Pavement leads off the High Street to the right and exits to Market Hill. |
Return to Welcome to Royston (Iceni) Weather Station page
(This page last updated 10th December 2010 2125 GMT)