Royston (Iceni) Weather Station
Daily Weather Observations - May 2010
(All Times GMT)
| Date | Max. Temp. (°C) 09/09h | Min. Temp. (°C) 09/09h | Grass Min. Temp. (°C) 21/09h | Earth (30cms) Temp. (°C) 09h | Sun (Hours) 00/00h | R'fall (MM) 09/09h | Wind Dir'n 09h | Mean Wind Speed (MPH) 00/00h | Max. Gust Speed (MPH) 00/00h | Cloud Cover (Oktas) 09h | Mean MSL Air Pressure (mB) 00/00h | Mean Rel. Humd. (%) 00/00h | Mean Temp. (°C) 00/00h | Fog (vis. <1000m @ 09h) | Fog (vis. <200m @ 09h) | Snow or Rain and Snow 00/00h | Snow Lying @ 09h (>50% cover) | Hail 00/00h | Thunder 00/00h | Date |
| 1 | 16.9 | 8.6 | 6.8 | 12.8 | 2.3 | 19.4 | NW | 4.1 | 16 | 4 | 1008.3 | 74.7 | 11.6 | 0 | 0 | 0 | 0 | 0 | 0 | 1 |
| 2 | 9.9 | 6.5 | 6.5 | 12.9 | 0.2 | 3.5 | NE | 8.0 | 26 | 8 | 1012.3 | 85.3 | 7.2 | 0 | 0 | 0 | 0 | 0 | 0 | 2 |
| 3 | 11.8 | 3.7 | 1.8 | 11.8 | 7.4 | 0.3 | N | 7.8 | 31 | 6 | 1022.1 | 75.2 | 6.4 | 0 | 0 | 0 | 0 | 1 | 0 | 3 |
| 4 | 13.0 | 1.5 | -2.2 | 11.4 | 6.2 | 0.0 | N | 4.6 | 19 | 5 | 1026.4 | 69.1 | 7.4 | 0 | 0 | 0 | 0 | 0 | 0 | 4 |
| 5 | 14.9 | 4.0 | -0.5 | 11.4 | 0.9 | 0.0 | NW | 2.2 | 12 | 8 | 1019.9 | 73.0 | 10.0 | 0 | 0 | 0 | 0 | 0 | 0 | 5 |
| 6 | 16.3 | 7.7 | 5.3 | 11.8 | 7.6 | 0.0 | NE | 3.7 | 19 | 8 | 1012.5 | 69.9 | 9.7 | 0 | 0 | 0 | 0 | 0 | 0 | 6 |
| 7 | 13.7 | 3.0 | -0.4 | 12.1 | 0.9 | 0.5 | NE | 5.0 | 24 | 7 | 1011.6 | 72.9 | 8.3 | 0 | 0 | 0 | 0 | 0 | 0 | 7 |
| 8 | 9.2 | 6.1 | 6.0 | 12.0 | 0.1 | 2.3 | N | 5.6 | 21 | 8 | 1012.3 | 87.9 | 7.3 | 0 | 0 | 0 | 0 | 0 | 0 | 8 |
| 9 | 13.1 | 5.7 | 5.5 | 11.5 | 0.5 | 0.0 | NE | 4.0 | 19 | 8 | 1012.4 | 77.4 | 8.3 | 0 | 0 | 0 | 0 | 0 | 0 | 9 |
| 10 | 12.6 | 2.0 | -1.2 | 11.2 | 3.7 | 0.0 | NE | 3.9 | 19 | 5 | 1012.7 | 72.6 | 7.3 | 0 | 0 | 0 | 0 | 0 | 0 | 10 |
| 11 | 11.2 | 0.1 | -3.0 | 11.4 | 3.6 | 0.0 | NE | 3.0 | 20 | 6 | 1012.8 | 70.9 | 5.8 | 0 | 0 | 0 | 0 | 0 | 0 | 11 |
| 12 | 13.9 | -0.5 | -4.1 | 10.9 | 7.7 | 0.0 | N | 3.1 | 20 | 6 | 1014.8 | 67.3 | 6.3 | 0 | 0 | 0 | 0 | 0 | 0 | 12 |
| 13 | 14.8 | 0.2 | -4.0 | 11.0 | 7.2 | 0.0 | NE | 2.1 | 13 | 2 | 1013.8 | 63.2 | 7.6 | 0 | 0 | 0 | 0 | 0 | 0 | 13 |
| 14 | 16.5 | 4.0 | 2.5 | 11.5 | 6.3 | 0.0 | SW | 6.2 | 21 | 2 | 1011.3 | 60.8 | 10.4 | 0 | 0 | 0 | 0 | 0 | 0 | 14 |
| 15 | 17.7 | 7.4 | 5.1 | 12.0 | 6.7 | TR | NW | 4.6 | 18 | 3 | 1014.3 | 63.3 | 11.8 | 0 | 0 | 0 | 0 | 0 | 0 | 15 |
| 16 | 17.4 | 5.9 | 2.1 | 12.2 | 2.1 | 1.1 | SW | 5.8 | 21 | 8 | 1015.3 | 72.0 | 11.0 | 0 | 0 | 0 | 0 | 0 | 0 | 16 |
| 17 | 18.0 | 5.5 | 1.7 | 12.2 | 6.3 | 0.6 | W | 4.3 | 19 | 7 | 1023.2 | 70.3 | 10.9 | 0 | 0 | 0 | 0 | 0 | 0 | 17 |
| 18 | 18.8 | 5.4 | 1.1 | 12.4 | 5.9 | 0.0 | E | 2.8 | 13 | 1 | 1028.1 | 66.0 | 12.3 | 0 | 0 | 0 | 0 | 0 | 0 | 18 |
| 19 | 20.5 | 8.1 | 6.4 | 12.7 | 5.7 | 0.0 | SW | 4.8 | 16 | 0 | 1028.8 | 68.9 | 14.6 | 0 | 0 | 0 | 0 | 0 | 0 | 19 |
| 20 | 25.0 | 11.9 | 7.0 | 13.5 | 4.9 | 0.0 | W | 3.3 | 12 | 8 | 1030.9 | 71.3 | 17.7 | 0 | 0 | 0 | 0 | 0 | 0 | 20 |
| 21 | 25.5 | 13.0 | 10.1 | 14.8 | 12.0 | 0.0 | NE | 3.5 | 15 | 0 | 1030.7 | 67.8 | 18.4 | 0 | 0 | 0 | 0 | 0 | 0 | 21 |
| 22 | 24.6 | 9.0 | 5.6 | 15.4 | 13.3 | 0.0 | NE | 2.7 | 13 | 0 | 1028.8 | 68.6 | 16.6 | 0 | 0 | 0 | 0 | 0 | 0 | 22 |
| 23 | 28.1 | 9.8 | 6.0 | 16.0 | 15.7 | 0.0 | NW | 2.9 | 16 | 0 | 1022.8 | 61.8 | 19.7 | 0 | 0 | 0 | 0 | 0 | 0 | 23 |
| 24 | 28.0 | 15.5 | 12.0 | 16.9 | 13.2 | 0.0 | NW | 4.2 | 17 | 0 | 1013.8 | 61.9 | 19.9 | 0 | 0 | 0 | 0 | 0 | 0 | 24 |
| 25 | 19.8 | 10.5 | 8.9 | 17.4 | 5.9 | 0.0 | NE | 3.5 | 16 | 5 | 1012.5 | 69.5 | 13.7 | 0 | 0 | 0 | 0 | 0 | 0 | 25 |
| 26 | 16.9 | 6.0 | 3.3 | 16.8 | 1.8 | 7.0 | NE | 3.4 | 17 | 6 | 1009.9 | 71.2 | 11.2 | 0 | 0 | 0 | 0 | 0 | 0 | 26 |
| 27 | 17.2 | 7.5 | 7.2 | 16.1 | 5.2 | 0.0 | W | 3.8 | 16 | 6 | 1009.2 | 70.0 | 11.6 | 0 | 0 | 0 | 0 | 0 | 0 | 27 |
| 28 | 19.5 | 7.6 | 5.0 | 15.9 | 13.1 | 0.0 | W | 7.3 | 20 | 3 | 1013.2 | 56.5 | 13.5 | 0 | 0 | 0 | 0 | 0 | 0 | 28 |
| 29 | 15.0 | 10.2 | 8.5 | 16.0 | 0.1 | 2.4 | SE | 7.2 | 26 | 8 | 1009.2 | 81.6 | 12.7 | 0 | 0 | 0 | 0 | 0 | 0 | 29 |
| 30 | 18.3 | 11.7 | 10.4 | 15.4 | 8.1 | TR | W | 11.7 | 35 | 6 | 1009.9 | 63.8 | 14.0 | 0 | 0 | 0 | 0 | 0 | 0 | 30 |
| 31 | 17.1 | 10.4 | 8.7 | 15.8 | 1.0 | TR | N | 4.9 | 22 | 8 | 1018.8 | 77.2 | 12.5 | 0 | 0 | 0 | 0 | 0 | 0 | 31 |
| Total/Mean | 17.3 | 6.7 | 4.1 | 13.4 | 175.2 | 37.1 | X | 4.6 | X | 4.9 | 1016.9 | 70.4 | 11.5 | 0 | 0 | 0 | 0 | 1 | 0 | Total/Mean |
| *Diff./% | +0.3 | -0.7 | 92% | 79% | *Diff./% | |||||||||||||||
| Date | Max. Temp. (°C) 09/09h | Min. Temp. (°C) 09/09h | Grass Min. Temp. (°C) 21/09h | Earth (30cms) Temp. (°C) 09h | Sun (Hours) 00/00h | R'fall (MM) 09/09h | Wind Dir'n 09h | Mean Wind Speed (MPH) 00/00h | Max. Gust Speed (MPH) 00/00h | Cloud Cover (Oktas) 09h | Mean MSL Air Pressure (mB) 00/00h | Mean Rel. Humd. (%) 00/00h | Mean Temp. (°C) 00/00h | Fog (vis. <1000m @ 09h) | Fog (vis. <200m @ 09h) | Snow or Rain and Snow 00/00h | Snow Lying @ 09h (>50% cover) | Hail 00/00h | Thunder 00/00h | Date |
Differences from average:
Differences from average shown in red. Reference periods used are as follows: Temperature 30 Years 1976/2005; rainfall 30 Years 1971/2000; sunshine 30 Years 1971/2000.
(*The differences from average quoted during the course of the month relate to the cumulative daily averages up to the date of the last observation, not the averages for the month as a whole)
Additional Data:
Rainfall Duration N/A
Air Frost Duration 2.4 hours
Graphs and Charts:
Click on the following links to view this month's graphs and charts.....
1. Daily Maximum, Minimum & Grass Minimum Temperatures
2. Daily Maximum & Minimum Temperatures (with 30 Year Comparative Means)
3. Daily Earth (30 cms Depth) Temperature @ 0900 GMT 4. Daily Rainfall 5. Daily Sunshine
6. Daily Maximum Gust & Mean Wind Speed 7. Daily Wind Direction @ 0900 GMT
8. Daily Mean MSL Air Pressure 9. Daily Mean Relative Humidity 10. Thermograph
11. Barograph 12. Hygrograph 13. Anemograph 14. Wind Direction
15. Rainfall Intensity & Duration
May 2010 Weather Review:
......and click on the link below for a text report of the May 2010 weather in Royston
May (since 1972) at Royston (Iceni) Weather Station:
Mean daily maximum temperature (30 years 1976/2005) 17.0°C
Mean daily minimum temperature (30 years 1976/2005) 7.4°C
Highest temperature 30.3°C (27th May 2005); lowest temperature -1.0°C (16th May1996)
Lowest grass minimum temperature -5.2°C (16th May 1996)
Warmest May 1992 (Mean temperature 14.5°C); coldest May 1984, 1996 (Mean temperature 9.7°C)
Average May rainfall (30 years 1971/2000) 47.0 mm
Wettest May 2007 (Rainfall 147.5 mm); driest May 1990 (Rainfall 3.7 mm)
Wettest Day 27th May 2007 (Rainfall 65.7 mm)
Highest number of "rain days" (0.2 mm or more) 22 (1983); lowest number of "rain days" 3 (1990)
Highest number of days with thunder 8 (1983)
Highest number of air frosts 4 (1996)
Highest number of ground frosts 14 (1996)
Highest number of days with snow falling 2 (1997)
Highest number of days with snow lying (ground with more than 50% snow cover @ 0900 GMT) 0
|
|
|
|
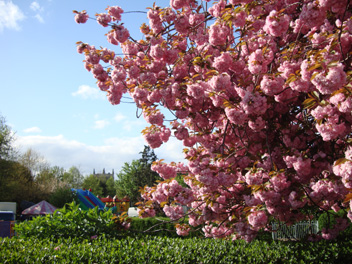
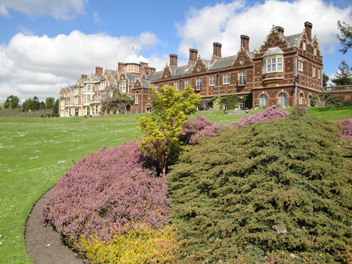
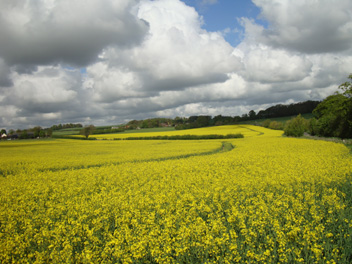
| The kanzan cherry trees bordering the A10 Priory Lane in Royston have this Spring once again provided a fine display of blossom. This view is looking over the hedge from Priory Lane into Priory Gardens where the annual Royston May Fayre is just coming to an end, the photograph having been taken at 1600 GMT (on 3rd May 2010). The tower of the 12th Century St. John the Baptist Church can just be discerned on the other side of the gardens. The weather was not ideal for the Fayre with the maximum temperature being only 11.8°C (3.2°C below the 30 Year (1976/2005) average for this day) in a fresh breeze (10 knots gusting to 22 knots from the NNE at the time the picture was taken) but at least a fair amount of sunshine was experienced (7.4 hours over the whole day). | On Sunday 9th May 2010 the members of the Royston Allotments and Gardens Association travelled some 100 km northwards to the Sandringham Estate, the Norfolk retreat of H M The Queen, for their annual outing. The Sandringham House (photographed here at 1254 GMT from near the Lake in a NE direction) is set in 60 acres of glorious gardens at the heart of the 20,000 acre Sandringham Estate, 600 acres of which make up the the woodland and heath of the Country Park. Also on the estate is the parish church of St. Mary Magdalene with its host of carved and painted angels and its many Royal memorials. Fortunately the weather at Sandringham on this day was mainly sunny, whereas at Royston it was mainly cloudy and only 0.5 hours sunshine was recorded! | This spectacular display of oilseed rape is situated between Heath Farm and the B1039 Royston to Saffron Walden road some 1.5 km to the SE of Royston. The photograph was taken on 11th May 2010 at 0817 GMT looking towards Royston along the line of the road on the right of the picture. The crop does not seem to have been unduly affected by the very dry April, but would have benefited from the 19.4 millimetres rainfall on 1st May, which amount exceeded the rainfall for the whole of April! At this time the temperature had risen rapidly in the early morning sunshine from an overnight minimum of 0.1°C to 7.1°C, and later achieved a maximum of 11.2°C. A NNE breeze of mean speed 4 knots gusting to 8 knots is being drawn across the landscape by an area of low pressure to the SE over Europe. |
Return to Welcome to Royston (Iceni) Weather Station page
(This page last updated 13th June 2010 1959 GMT)