
Royston (Iceni) Weather Station
Daily Weather Observations - November 2009
(All Times GMT)
| Date | Max. Temp. (°C) 09/09h | Min. Temp. (°C) 09/09h | Grass Min. Temp. (°C) 21/09h | Earth (30cms) Temp. (°C) 09h | Sun (Hours) 00/00h | R'fall (MM) 09/09h | Wind Dir'n 09h | Mean Wind Speed (MPH) 00/00h | Max. Gust Speed (MPH) 00/00h | Cloud Cover (Oktas) 09h | Mean MSL Air Pressure (mB) 00/00h | Mean Rel. Humd. (%) 00/00h | Mean Temp. (°C) 00/00h | Fog (vis. <1000m @ 09h) | Fog (vis. <200m @ 09h) | Snow or Rain and Snow 00/00h | Snow Lying @ 09h (>50% cover) | Hail 00/00h | Thunder 00/00h | Date |
| 1 | 16.2 | 10.3 | 8.6 | 12.2 | 0.8 | 7.6 | SE | 10.7 | 36 | 8 | 1001.9 | 86.1 | 11.9 | 0 | 0 | 0 | 0 | 0 | 0 | 1 |
| 2 | 12.5 | 5.8 | 3.3 | 11.7 | 7.2 | 3.7 | SW | 7.4 | 20 | 0 | 998.7 | 78.9 | 8.2 | 0 | 0 | 0 | 0 | 0 | 0 | 2 |
| 3 | 13.0 | 6.5 | 3.7 | 10.9 | 2.2 | 1.4 | S | 8.8 | 24 | 7 | 986.8 | 86.1 | 9.4 | 0 | 0 | 0 | 0 | 0 | 0 | 3 |
| 4 | 11.7 | 5.2 | 2.9 | 10.6 | 7.0 | 2.3 | SW | 9.0 | 25 | 1 | 984.4 | 81.5 | 7.7 | 0 | 0 | 0 | 0 | 0 | 0 | 4 |
| 5 | 10.8 | 5.9 | 1.7 | 10.0 | 2.5 | 0.2 | W | 7.7 | 22 | 1 | 991.6 | 85.7 | 8.7 | 0 | 0 | 0 | 0 | 0 | 0 | 5 |
| 6 | 10.8 | 7.6 | 6.0 | 10.1 | 0.5 | 4.2 | W | 5.9 | 24 | 8 | 998.3 | 88.0 | 9.0 | 0 | 0 | 0 | 0 | 0 | 0 | 6 |
| 7 | 9.5 | 3.7 | 0.9 | 10.1 | 8.0 | 1.9 | W | 6.6 | 19 | 0 | 993.9 | 82.0 | 6.3 | 0 | 0 | 0 | 0 | 0 | 0 | 7 |
| 8 | 10.9 | 5.0 | 2.0 | 9.3 | 3.5 | 0.0 | NE | 2.0 | 13 | 4 | 1005.3 | 87.4 | 6.8 | 0 | 0 | 0 | 0 | 0 | 0 | 8 |
| 9 | 8.1 | 2.1 | -2.5 | 8.8 | 1.5 | 0.0 | W | 3.9 | 14 | 8 | 1018.2 | 92.9 | 4.5 | 1 | 0 | 0 | 0 | 0 | 0 | 9 |
| 10 | 8.4 | 1.5 | -0.2 | 8.5 | 0.5 | 0.2 | SE | 2.5 | 12 | 8 | 1011.8 | 91.6 | 5.2 | 0 | 0 | 0 | 0 | 0 | 0 | 10 |
| 11 | 8.9 | 6.2 | 2.1 | 8.9 | 0.1 | 1.4 | S | 1.9 | 15 | 8 | 1005.8 | 90.9 | 7.7 | 0 | 0 | 0 | 0 | 0 | 0 | 11 |
| 12 | 13.4 | 7.1 | 4.7 | 9.2 | 4.2 | 13.1 | S | 8.3 | 28 | 1 | 999.3 | 88.7 | 10.3 | 0 | 0 | 0 | 0 | 0 | 0 | 12 |
| 13 | 15.5 | 9.0 | 6.1 | 9.5 | 0.1 | 11.5 | SE | 7.2 | 35 | 8 | 997.3 | 89.1 | 11.2 | 0 | 0 | 0 | 0 | 0 | 0 | 13 |
| 14 | 12.9 | 9.4 | 7.5 | 10.1 | 1.7 | 4.5 | S | 15.6 | 45 | 6 | 992.1 | 79.9 | 10.8 | 0 | 0 | 0 | 0 | 0 | 0 | 14 |
| 15 | 13.0 | 5.6 | 3.0 | 9.8 | 7.3 | 4.2 | S | 6.6 | 20 | 1 | 1004.3 | 86.3 | 8.9 | 0 | 0 | 0 | 0 | 0 | 0 | 15 |
| 16 | 13.0 | 7.2 | 5.0 | 9.4 | 4.6 | TR | S | 11.3 | 37 | 6 | 999.5 | 82.2 | 10.5 | 0 | 0 | 0 | 0 | 0 | 0 | 16 |
| 17 | 12.9 | 8.2 | 6.0 | 9.4 | 6.4 | TR | SW | 11.6 | 33 | 3 | 1006.1 | 77.1 | 9.7 | 0 | 0 | 0 | 0 | 0 | 0 | 17 |
| 18 | 14.3 | 9.5 | 8.4 | 9.1 | 0.0 | 0.0 | SW | 17.8 | 46 | 7 | 1008.3 | 75.4 | 12.6 | 0 | 0 | 0 | 0 | 0 | 0 | 18 |
| 19 | 14.1 | 12.2 | 10.9 | 9.7 | 4.6 | 0.6 | SW | 15.1 | 37 | 6 | 1009.6 | 74.8 | 12.7 | 0 | 0 | 0 | 0 | 0 | 0 | 19 |
| 20 | 14.3 | 12.2 | 10.5 | 9.9 | 2.9 | 0.9 | S | 11.0 | 34 | 8 | 1011.4 | 80.1 | 12.2 | 0 | 0 | 0 | 0 | 0 | 0 | 20 |
| 21 | 15.4 | 8.5 | 6.5 | 10.0 | 0.6 | 5.7 | S | 8.9 | 32 | 8 | 1011.8 | 89.5 | 12.1 | 0 | 0 | 0 | 0 | 0 | 0 | 21 |
| 22 | 10.8 | 7.8 | 6.0 | 10.4 | 2.4 | 7.3 | S | 14.1 | 40 | 0 | 999.2 | 79.8 | 9.2 | 0 | 0 | 0 | 0 | 0 | 0 | 22 |
| 23 | 13.1 | 7.6 | 6.0 | 9.6 | 1.3 | 0.2 | SW | 13.9 | 39 | 8 | 997.5 | 79.9 | 9.7 | 0 | 0 | 0 | 0 | 0 | 0 | 23 |
| 24 | 13.8 | 7.9 | 6.2 | 9.5 | 0.0 | 7.4 | SW | 15.1 | 42 | 8 | 1003.4 | 80.2 | 11.6 | 0 | 0 | 0 | 0 | 0 | 0 | 24 |
| 25 | 11.0 | 7.8 | 5.7 | 10.0 | 6.5 | 0.5 | SW | 14.0 | 50 | 0 | 997.1 | 78.9 | 9.4 | 0 | 0 | 0 | 0 | 0 | 0 | 25 |
| 26 | 9.5 | 6.1 | 4.5 | 9.1 | 6.6 | 0.0 | SW | 11.3 | 33 | 1 | 999.1 | 78.2 | 7.0 | 0 | 0 | 0 | 0 | 0 | 0 | 26 |
| 27 | 8.1 | 4.0 | 2.1 | 8.4 | 5.4 | 2.5 | SW | 9.9 | 30 | 4 | 997.4 | 83.3 | 5.5 | 0 | 0 | 0 | 0 | 0 | 0 | 27 |
| 28 | 8.0 | 3.5 | 1.7 | 7.7 | 2.6 | 14.4 | SW | 7.7 | 36 | 2 | 992.0 | 84.6 | 5.2 | 0 | 0 | 0 | 0 | 0 | 0 | 28 |
| 29 | 7.6 | 4.3 | 1.5 | 7.6 | 1.1 | 8.5 | S | 4.6 | 24 | 7 | 985.2 | 90.6 | 6.2 | 0 | 0 | 0 | 0 | 0 | 0 | 29 |
| 30 | 5.7 | 4.2 | 1.5 | 7.5 | 1.6 | 0.2 | N | 7.7 | 28 | 8 | 998.9 | 89.1 | 4.5 | 0 | 0 | 0 | 0 | 0 | 0 | 30 |
| Total/Mean | 11.6 | 6.7 | 4.4 | 9.6 | 93.3 | 104.4 | X | 9.3 | X | 4.8 | 1000.2 | 84.0 | 8.8 | 1 | 0 | 0 | 0 | 0 | 0 | Total/Mean |
| *Diff./% | +1.9 | +1.8 | 137% | 199% | *Diff./% | |||||||||||||||
| Date | Max. Temp. (°C) 09/09h | Min. Temp. (°C) 09/09h | Grass Min. Temp. (°C) 21/09h | Earth (30cms) Temp. (°C) 09h | Sun (Hours) 00/00h | R'fall (MM) 09/09h | Wind Dir'n 09h | Mean Wind Speed (MPH) 00/00h | Max. Gust Speed (MPH) 00/00h | Cloud Cover (Oktas) 09h | Mean MSL Air Pressure (mB) 00/00h | Mean Rel. Humd. (%) 00/00h | Mean Temp. (°C) 00/00h | Fog (vis. <1000m @ 09h) | Fog (vis. <200m @ 09h) | Snow or Rain and Snow 00/00h | Snow Lying @ 09h (>50% cover) | Hail 00/00h | Thunder 00/00h | Date |
Differences from average:
Differences from average shown in red. Reference periods used are as follows: Temperature 30 Years 1976/2005; rainfall 30 Years 1971/2000; sunshine 30 Years 1971/2000.
(*The differences from average quoted during the course of the month relate to the cumulative daily averages up to the date of the last observation, not the averages for the month as a whole)
Additional Data:
Rainfall Duration 74.1 hours
Air Frost Duration NIL hours
Graphs and Charts:
Click on the following links to view this month's graphs and charts.....
1. Daily Maximum, Minimum & Grass Minimum Temperatures
2. Daily Maximum & Minimum Temperatures (with 30 Year Comparative Means)
3. Daily Earth (30 cms Depth) Temperature @ 0900 GMT 4. Daily Rainfall 5. Daily Sunshine
6. Daily Maximum Gust & Mean Wind Speed 7. Daily Wind Direction @ 0900 GMT
8. Daily Mean MSL Air Pressure 9. Daily Mean Relative Humidity 10. Thermograph
11. Barograph 12. Hygrograph 13. Anemograph 14. Wind Direction
15. Sunshine Duration 16. Rainfall Intensity & Duration
November 2009 Weather Review:
......and click on the link below for a text report of the November 2009 weather in Royston
November (since 1972) at Royston (Iceni) Weather Station:
Mean day maximum temperature (30 years 1976/2005) 9.7°C
Mean night minimum temperature (30 years 1976/2005) 4.9°C
Highest temperature 17.8°C (2nd November 1984); lowest temperature -6.9°C (30th November 1978)
Lowest grass minimum temperature -10.5°C (30th November 1978)
Warmest November 1994 (Mean temperature 10.5°C); coldest November 1985 (Mean temperature 4.2°C)
Average November rainfall (30 years 1971/2000) 52.4 mm
Wettest November 2000 (Rainfall 118.2 mm); driest November 1978 (Rainfall 17.2 mm)
Wettest Day 18th November 2004 (Rainfall 28.3 mm)
Highest number of "rain days" (0.2 mm or more) 23 (1974); lowest number of "rain days" 7 (1978)
Highest number of days with thunder 2 (1974)
Highest number of air frosts 10 (1985, 1996)
Highest number of ground frosts 17 (1985, 1988)
Highest number of days with snow falling 4 (1980, 1985)
Highest number of days with snow lying (ground with more than 50% snow cover @ 0900 GMT) 5 (1988)
|
|
|
|
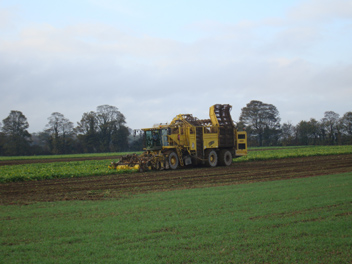
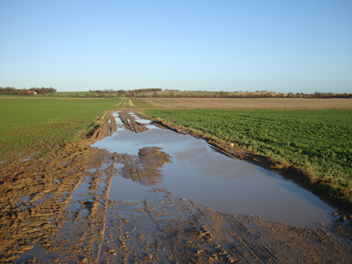
| Near the end of an essentially sunny day (sunshine 7.0 hours) on 4th November 2009, at 1603 GMT this rainbow was spotted from the northern fringes of Royston and looking in a northerly direction. At the time an area of low pressure was situated just NW of Scotland and an eastward moving trough on its southern flank crossed Royston producing a light shower. The combination of this rain and low sun gave rise to a very large rainbow, only a part of which is shown here. The temperature is 9.7°C and a SW wind of mean speed 5 knots gusting to 10 knots is currently being drawn across the town. The maximum temperature for the day was 11.7°C, just 0.3°C above the 30 Year (1976/2005) mean for this day. | The beet sugar campaign is in full swing and on 8th November 2009 (at 0908 GMT) this harvester is lifting the beet on a small acreage at Lowerfield Farm to the east of Royston. On an adjacent farm behind the tree belt in the background a much larger area of beet sugar has been grown and harvesting of this crop commenced on 26th November. The beet collected by the harvester is transferred at regular intervals to tractor and trailer combinations and taken off site to temporary storage before removal to one of the East Anglian processing plants. After the dry start to the Autumn recent rainfall has softened the ground somewhat and aided the lifting process, albeit making the operation more muddy. | This normally dry farm track across land to the east of Royston has at this point fallen victim to mud from recent beet sugar harvesting (see adjacent caption) and a wetter than average November, with another 7.4 millimetres rainfall occurring overnight just prior to this photograph being taken (at 0857 GMT on 25th November 2009). This brought the cumulative rainfall for the month to date up to 78.3 millimetres (monthly average 52.4 millimetres). A deep low is situated just to the N of the Western Isles and a cold front in its circulation has recently moved eastwards across the region. The temperature is 7.9°C after an overnight minimum of 7.8°C and a SSW wind of mean speed 11 knots gusting to 20 knots was recorded at this time. |
Return to Welcome to Royston (Iceni) Weather Station page
(This page last updated 13th December 2009 2106 GMT)