Royston (Iceni) Weather Station
Daily Weather Observations - October 2009
(All Times GMT)
| Date | Max. Temp. (°C) 09/09h | Min. Temp. (°C) 09/09h | Grass Min. Temp. (°C) 21/09h | Earth (30cms) Temp. (°C) 09h | Sun (Hours) 00/00h | R'fall (MM) 09/09h | Wind Dir'n 09h | Mean Wind Speed (MPH) 00/00h | Max. Gust Speed (MPH) 00/00h | Cloud Cover (Oktas) 09h | Mean MSL Air Pressure (mB) 00/00h | Mean Rel. Humd. (%) 00/00h | Mean Temp. (°C) 00/00h | Fog (vis. <1000m @ 09h) | Fog (vis. <200m @ 09h) | Snow or Rain and Snow 00/00h | Snow Lying @ 09h (>50% cover) | Hail 00/00h | Thunder 00/00h | Date |
| 1 | 16.8 | 11.6 | 8.9 | 15.4 | 5.0 | 0.0 | NW | 4.9 | 20 | 3 | 1017.0 | 69.4 | 12.9 | 0 | 0 | 0 | 0 | 0 | 0 | 1 |
| 2 | 16.5 | 6.5 | 3.0 | 14.6 | 4.4 | 0.0 | W | 6.7 | 18 | 2 | 1016.7 | 71.5 | 11.9 | 0 | 0 | 0 | 0 | 0 | 0 | 2 |
| 3 | 17.0 | 12.2 | 11.0 | 14.7 | 2.9 | 2.0 | SW | 12.8 | 38 | 8 | 1006.2 | 76.6 | 13.5 | 0 | 0 | 0 | 0 | 0 | 0 | 3 |
| 4 | 17.1 | 8.4 | 7.2 | 14.6 | 8.5 | 0.0 | W | 6.6 | 19 | 4 | 1010.3 | 69.4 | 11.5 | 0 | 0 | 0 | 0 | 0 | 0 | 4 |
| 5 | 15.3 | 9.5 | 6.9 | 14.0 | 0.0 | 1.4 | E | 1.9 | 11 | 8 | 1008.9 | 84.0 | 11.8 | 0 | 0 | 0 | 0 | 0 | 0 | 5 |
| 6 | 19.3 | 12.1 | 11.8 | 14.1 | 1.3 | 5.5 | S | 9.3 | 29 | 8 | 1004.9 | 88.5 | 16.2 | 0 | 0 | 0 | 0 | 0 | 0 | 6 |
| 7 | 12.8 | 10.2 | 10.2 | 14.9 | 0.1 | 6.9 | N | 3.2 | 15 | 8 | 1009.4 | 88.8 | 12.1 | 0 | 0 | 0 | 0 | 0 | 0 | 7 |
| 8 | 16.1 | 3.5 | -0.2 | 14.1 | 8.8 | 0.0 | W | 1.4 | 13 | 1 | 1017.7 | 80.6 | 8.5 | 0 | 0 | 0 | 0 | 0 | 0 | 8 |
| 9 | 14.0 | 3.5 | 0.0 | 13.0 | 1.8 | 3.0 | E | 3.0 | 22 | 6 | 1016.5 | 85.5 | 9.5 | 0 | 0 | 0 | 0 | 0 | 0 | 9 |
| 10 | 17.1 | 11.0 | 8.1 | 13.1 | 3.8 | 0.8 | W | 5.1 | 19 | 7 | 1013.8 | 83.8 | 13.2 | 0 | 0 | 0 | 0 | 0 | 0 | 10 |
| 11 | 15.4 | 11.4 | 9.9 | 13.5 | 1.8 | 0.0 | SW | 7.7 | 24 | 8 | 1014.5 | 80.9 | 12.3 | 0 | 0 | 0 | 0 | 0 | 0 | 11 |
| 12 | 15.2 | 6.4 | 2.9 | 13.0 | 6.7 | 0.0 | N | 4.0 | 22 | 0 | 1026.9 | 78.9 | 9.7 | 0 | 0 | 0 | 0 | 0 | 0 | 12 |
| 13 | 16.3 | 4.9 | 0.8 | 12.4 | 9.2 | 0.6 | W | 1.4 | 10 | 1 | 1030.4 | 76.9 | 9.7 | 0 | 0 | 0 | 0 | 0 | 0 | 13 |
| 14 | 14.0 | 9.6 | 8.7 | 12.3 | 0.6 | 0.0 | W | 2.2 | 13 | 7 | 1031.2 | 78.1 | 10.8 | 0 | 0 | 0 | 0 | 0 | 0 | 14 |
| 15 | 14.7 | 8.5 | 7.7 | 12.5 | 0.1 | 1.2 | W | 1.9 | 11 | 8 | 1032.1 | 73.0 | 11.1 | 0 | 0 | 0 | 0 | 0 | 0 | 15 |
| 16 | 14.3 | 9.9 | 9.5 | 12.9 | 2.8 | 0.0 | NW | 6.1 | 23 | 8 | 1031.8 | 78.9 | 10.7 | 0 | 0 | 0 | 0 | 0 | 0 | 16 |
| 17 | 12.2 | 7.1 | 3.6 | 12.5 | 0.1 | 0.0 | N | 3.5 | 17 | 8 | 1029.7 | 74.4 | 9.0 | 0 | 0 | 0 | 0 | 0 | 0 | 17 |
| 18 | 13.4 | 3.4 | -1.4 | 12.0 | 5.4 | 0.0 | W | 3.4 | 16 | 8 | 1023.3 | 71.9 | 7.3 | 0 | 0 | 0 | 0 | 0 | 0 | 18 |
| 19 | 11.3 | 5.5 | 3.9 | 11.5 | 0.8 | 0.0 | S | 5.7 | 19 | 7 | 1012.1 | 76.8 | 8.3 | 0 | 0 | 0 | 0 | 0 | 0 | 19 |
| 20 | 12.5 | 6.1 | 3.5 | 11.1 | 1.8 | 2.0 | SE | 4.7 | 24 | 4 | 998.0 | 77.7 | 9.1 | 0 | 0 | 0 | 0 | 0 | 0 | 20 |
| 21 | 12.9 | 10.5 | 8.6 | 11.4 | 0.0 | 1.3 | SE | 2.7 | 15 | 8 | 995.4 | 91.5 | 11.8 | 0 | 0 | 0 | 0 | 0 | 0 | 21 |
| 22 | 15.7 | 9.3 | 7.0 | 11.6 | 3.9 | 0.0 | SE | 3.5 | 19 | 6 | 998.3 | 86.4 | 11.5 | 0 | 0 | 0 | 0 | 0 | 0 | 22 |
| 23 | 16.7 | 8.5 | 7.4 | 11.5 | 8.3 | 0.7 | S | 5.8 | 19 | 1 | 1007.2 | 83.3 | 11.7 | 0 | 0 | 0 | 0 | 0 | 0 | 23 |
| 24 | 17.4 | 11.4 | 9.8 | 11.6 | 1.4 | 0.1 | S | 8.5 | 29 | 8 | 1004.8 | 86.7 | 14.1 | 0 | 0 | 0 | 0 | 0 | 0 | 24 |
| 25 | 16.5 | 10.2 | 8.2 | 12.0 | 6.7 | TR | SW | 12.2 | 32 | 7 | 1009.5 | 77.8 | 12.5 | 0 | 0 | 0 | 0 | 0 | 0 | 25 |
| 26 | 14.5 | 11.0 | 9.0 | 11.8 | 0.0 | 2.3 | W | 7.5 | 28 | 8 | 1016.7 | 76.6 | 12.2 | 0 | 0 | 0 | 0 | 0 | 0 | 26 |
| 27 | 16.8 | 9.9 | 5.0 | 11.9 | 2.0 | 0.0 | S | 5.8 | 25 | 8 | 1018.2 | 84.5 | 13.3 | 0 | 0 | 0 | 0 | 0 | 0 | 27 |
| 28 | 16.9 | 11.3 | 9.3 | 12.2 | 1.3 | 0.0 | S | 3.9 | 18 | 8 | 1017.5 | 83.3 | 13.6 | 0 | 0 | 0 | 0 | 0 | 0 | 28 |
| 29 | 16.5 | 9.4 | 5.0 | 12.3 | 2.7 | 0.0 | S | 2.2 | 14 | 8 | 1021.9 | 87.5 | 12.3 | 0 | 0 | 0 | 0 | 0 | 0 | 29 |
| 30 | 14.5 | 10.0 | 7.6 | 12.3 | 2.6 | 3.1 | SE | 5.3 | 20 | 6 | 1021.8 | 86.3 | 12.2 | 0 | 0 | 0 | 0 | 0 | 0 | 30 |
| 31 | 16.1 | 10.6 | 9.9 | 12.2 | 2.4 | 0.4 | S | 6.2 | 19 | 8 | 1019.6 | 90.1 | 12.7 | 0 | 0 | 0 | 0 | 0 | 0 | 31 |
| Total/Mean | 15.3 | 8.8 | 6.5 | 12.8 | 97.0 | 31.2 | X | 5.1 | X | 6.1 | 1015.6 | 80.6 | 11.5 | 0 | 0 | 0 | 0 | 0 | 0 | Total/Mean |
| *Diff./% | +0.7 | +0.8 | 84% | 55% | *Diff./% | |||||||||||||||
| Date | Max. Temp. (°C) 09/09h | Min. Temp. (°C) 09/09h | Grass Min. Temp. (°C) 21/09h | Earth (30cms) Temp. (°C) 09h | Sun (Hours) 00/00h | R'fall (MM) 09/09h | Wind Dir'n 09h | Mean Wind Speed (MPH) 00/00h | Max. Gust Speed (MPH) 00/00h | Cloud Cover (Oktas) 09h | Mean MSL Air Pressure (mB) 00/00h | Mean Rel. Humd. (%) 00/00h | Mean Temp. (°C) 00/00h | Fog (vis. <1000m @ 09h) | Fog (vis. <200m @ 09h) | Snow or Rain and Snow 00/00h | Snow Lying @ 09h (>50% cover) | Hail 00/00h | Thunder 00/00h | Date |
Differences from average:
Differences from average shown in red. Reference periods used are as follows: Temperature 30 Years 1976/2005; rainfall 30 Years 1971/2000; sunshine 30 Years 1971/2000.
(*The differences from average quoted during the course of the month relate to the cumulative daily averages up to the date of the last observation, not the averages for the month as a whole)
Additional Data:
Rainfall Duration 22.4 hours
Air Frost Duration NIL hours
Graphs and Charts:
Click on the following links to view this month's graphs and charts.....
1. Daily Maximum, Minimum & Grass Minimum Temperatures
2. Daily Maximum & Minimum Temperatures (with 30 Year Comparative Means)
3. Daily Earth (30 cms Depth) Temperature @ 0900 GMT 4. Daily Rainfall 5. Daily Sunshine
6. Daily Maximum Gust & Mean Wind Speed 7. Daily Wind Direction @ 0900 GMT
8. Daily Mean MSL Air Pressure 9. Daily Mean Relative Humidity 10. Thermograph
11. Barograph 12. Hygrograph 13. Anemograph 14. Wind Direction
15. Sunshine Duration 16. Rainfall Intensity & Duration
October 2009 Weather Review:
......and click on the link below for a text report of the October 2009 weather in Royston
October (since 1972) at Royston (Iceni) Weather Station:
Mean day maximum temperature (30 years 1976/2005) 14.6°C
Mean night minimum temperature (30 years 1976/2005) 8.0°C
Highest temperature 27.5°C (1st October 1985); lowest temperature -3.6°C (29th October 1997)
Lowest grass minimum temperature -8.3°C (29th October 1997)
Warmest October 2001 (Mean temperature 14.3°C); coldest October 1974 (Mean temperature 7.3°C)
Highest no. of days with air frost 5 (1997); highest no. of days with ground frost 13 (2003)
Average October rainfall (30 years 1971/2000) 57.0 mm
Wettest October 2001 (Rainfall 137.8 mm); driest October 1972 (Rainfall 4.1 mm)
Wettest Day 20th October 2001 (Rainfall 51.8 mm);
Highest number of "rain days" (0.2 mm or more) 23 (2000); lowest number of "rain days" 3 (1972)
Highest number of days with thunder 3 (1984)
|
|
|
|
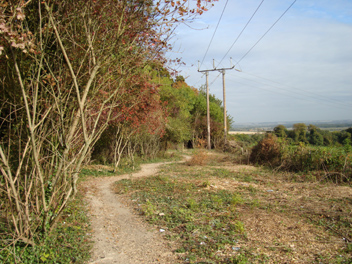
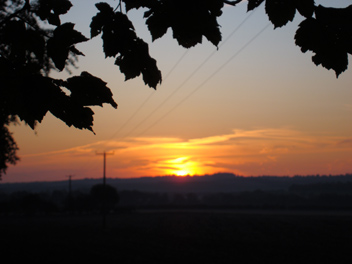
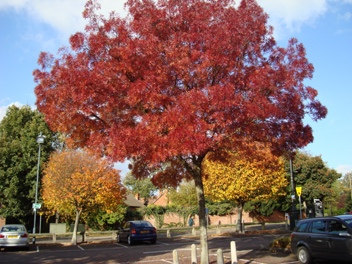
| This footpath through Bury Plantation on the eastern fringe of Royston was completely enclosed by trees and bushes until mid-July 2009 when this vegetation was cut down to arrest the encroachment on the overhead power line. This picture was taken on 2nd October 2009 at 0857 GMT. To the right (not shown) is a field of beet sugar which was harvested later in the month. This view is looking northwards just to the west of the Greenwich Meridian and over towards the South Cambridgeshire Plain. The temperature at this time was 12.1°C after an overnight minimum of 6.5°C, later rising to a maximum for the day of 16.5°C. The wind direction is WNW and the wind is of mean speed 6 knots gusting to 10 knots. | On 8th October 2009 a ridge of high pressure covered the British Isles extending to anticyclones over the Azores to the SW and NW Greenland to the NW. In this picture (at 0619 GMT) of the sunrise over Royston that day the sky is mostly clear of cloud restricting the colour of the sunrise to the patch of cloud close to the horizon. This view is from the Icknield Way about 1.5 km E of Royston and looking towards the village of Great Chishill on the horizon. The temperature at sunrise was 3.8°C, only just above the overnight minimum of 3.5°C. The maximum temperature for the day of 16.1°C was close to the 30 Year (1976/2005) mean for this day, whilst a creditable 8.8 hours sunshine was logged by sunset. | A feature of the Civic Centre car park in downtown Royston is the liberal spread of shapely trees bordering the parking bays. These trees produce a splendid display of blossom in Spring and an equally impressive display of colours in the Autumn. In this photograph taken at 1407 GMT on 22nd October 2009 just a small number of the tree population on this site is visible. To the rear of the photographer lie the Town Hall and the Health Centre whlist in the distance buildings on the E side of Melbourn Road are just visible. A SE wind of mean speed 5 knots gusting to 13 knots is drifting across Royston at this time and the temperature is 15.3°C, just below the daily maximum of 15.7°C. A total of 3.9 hours.sunshine was recorded for the day. |
Return to Welcome to Royston (Iceni) Weather Station page
(This page last updated 12th November 2009 2112 GMT)