Royston (Iceni) Weather Station
Daily Weather Observations - JULY 2009
(All Times GMT)
| Date | Max. Temp. (°C) 09/09h | Min. Temp. (°C) 09/09h | Grass Min. Temp. (°C) 21/09h | Earth (30cms) Temp. (°C) 09h | Sun (Hours) 00/00h | R'fall (MM) 09/09h | Wind Dir'n 09h | Mean Wind Speed (MPH) 00/00h | Max. Gust Speed (MPH) 00/00h | Cloud Cover (Oktas) 09h | Mean MSL Air Pressure (mB) 00/00h | Mean Rel. Humd. (%) 00/00h | Mean Temp. (°C) 00/00h | Fog (vis. <1000m @ 09h) | Fog (vis. <200m @ 09h) | Snow or Rain and Snow 00/00h | Snow Lying @ 09h (>50% cover) | Hail 00/00h | Thunder 00/00h | Date |
| 1 | 29.1 | 13.9 | 13.5 | 20.8 | 11.3 | 0.0 | E | 2.6 | 12 | 6 | 1021.6 | 70.8 | 20.7 | 0 | 0 | 0 | 0 | 0 | 0 | 1 |
| 2 | 28.5 | 12.5 | 10.0 | 20.8 | 14.7 | 0.0 | SE | 1.9 | 15 | 0 | 1016.7 | 70.6 | 21.1 | 0 | 0 | 0 | 0 | 0 | 0 | 2 |
| 3 | 24.5 | 16.5 | 14.0 | 21.0 | 4.1 | 0.0 | SW | 5.3 | 24 | 8 | 1011.1 | 74.0 | 20.0 | 0 | 0 | 0 | 0 | 0 | 0 | 3 |
| 4 | 25.2 | 14.0 | 10.8 | 20.3 | 10.8 | 0.0 | SW | 5.2 | 23 | 0 | 1011.1 | 62.5 | 20.0 | 0 | 0 | 0 | 0 | 0 | 0 | 4 |
| 5 | 25.2 | 15.2 | 14.0 | 20.4 | 7.5 | 0.0 | SW | 7.1 | 26 | 6 | 1007.9 | 64.2 | 19.1 | 0 | 0 | 0 | 0 | 0 | 0 | 5 |
| 6 | 21.8 | 13.0 | 11.6 | 19.9 | 7.8 | 1.0 | SW | 9.8 | 33 | 5 | 1002.8 | 73.8 | 16.5 | 0 | 0 | 0 | 0 | 0 | 0 | 6 |
| 7 | 19.5 | 12.2 | 10.9 | 19.3 | 5.4 | 4.9 | SW | 6.3 | 19 | 6 | 1002.2 | 86.5 | 15.0 | 0 | 0 | 0 | 0 | 0 | 0 | 7 |
| 8 | 20.5 | 12.0 | 10.5 | 18.6 | 1.9 | 0.1 | W | 5.3 | 17 | 8 | 1010.2 | 73.1 | 15.3 | 0 | 0 | 0 | 0 | 0 | 0 | 8 |
| 9 | 21.5 | 10.1 | 8.3 | 18.5 | 6.7 | 0.0 | W | 8.2 | 21 | 6 | 1013.6 | 64.5 | 14.9 | 0 | 0 | 0 | 0 | 0 | 0 | 9 |
| 10 | 22.0 | 9.1 | 7.4 | 18.5 | 11.1 | 2.0 | W | 8.0 | 22 | 5 | 1014.1 | 62.0 | 15.7 | 0 | 0 | 0 | 0 | 0 | 0 | 10 |
| 11 | 22.1 | 13.9 | 13.5 | 19.0 | 1.7 | 5.0 | SW | 5.6 | 22 | 8 | 1011.3 | 83.4 | 16.8 | 0 | 0 | 0 | 0 | 0 | 0 | 11 |
| 12 | 23.5 | 14.4 | 13.8 | 19.0 | 8.9 | 0.0 | W | 9.3 | 31 | 6 | 1005.2 | 68.8 | 18.2 | 0 | 0 | 0 | 0 | 0 | 0 | 12 |
| 13 | 21.8 | 13.2 | 11.7 | 19.1 | 9.1 | 1.9 | SW | 7.5 | 25 | 5 | 1007.2 | 69.8 | 17.3 | 0 | 0 | 0 | 0 | 0 | 0 | 13 |
| 14 | 22.6 | 13.0 | 11.6 | 19.0 | 9.0 | 2.3 | S | 7.6 | 27 | 4 | 1006.5 | 70.4 | 17.4 | 0 | 0 | 0 | 0 | 0 | 0 | 14 |
| 15 | 24.0 | 13.5 | 12.1 | 18.8 | 7.9 | 0.0 | S | 9.7 | 32 | 5 | 1010.1 | 71.0 | 18.2 | 0 | 0 | 0 | 0 | 0 | 0 | 15 |
| 16 | 23.5 | 12.8 | 11.5 | 18.9 | 7.4 | 11.5 | S | 5.1 | 17 | 3 | 1015.1 | 71.5 | 17.8 | 0 | 0 | 0 | 0 | 0 | 1 | 16 |
| 17 | 18.7 | 14.9 | 14.1 | 19.1 | 0.7 | 5.9 | SW | 6.7 | 27 | 8 | 1002.8 | 90.3 | 15.3 | 0 | 0 | 0 | 0 | 0 | 1 | 17 |
| 18 | 21.6 | 13.0 | 11.9 | 18.4 | 6.7 | 0.0 | W | 11.4 | 33 | 8 | 1007.3 | 69.7 | 16.3 | 0 | 0 | 0 | 0 | 0 | 0 | 18 |
| 19 | 18.8 | 12.4 | 11.2 | 18.5 | 1.5 | 6.5 | SW | 9.1 | 28 | 8 | 1008.5 | 81.5 | 15.1 | 0 | 0 | 0 | 0 | 0 | 0 | 19 |
| 20 | 20.6 | 11.7 | 10.3 | 18.1 | 8.4 | 3.3 | W | 7.9 | 27 | 3 | 1012.4 | 70.3 | 16.1 | 0 | 0 | 0 | 0 | 0 | 0 | 20 |
| 21 | 20.3 | 13.5 | 11.7 | 18.1 | 0.1 | 1.6 | SE | 5.7 | 27 | 8 | 1005.3 | 84.1 | 16.4 | 0 | 0 | 0 | 0 | 0 | 0 | 21 |
| 22 | 22.2 | 13.6 | 12.0 | 17.9 | 9.4 | 0.0 | SW | 10.4 | 32 | 6 | 1000.4 | 71.7 | 17.4 | 0 | 0 | 0 | 0 | 0 | 0 | 22 |
| 23 | 22.0 | 13.1 | 11.5 | 18.2 | 7.9 | 2.9 | W | 8.0 | 25 | 2 | 1001.8 | 73.8 | 16.7 | 0 | 0 | 0 | 0 | 0 | 0 | 23 |
| 24 | 20.2 | 12.7 | 11.4 | 18.1 | 6.1 | 4.6 | SW | 7.0 | 24 | 5 | 1008.9 | 80.4 | 15.2 | 0 | 0 | 0 | 0 | 0 | 1 | 24 |
| 25 | 23.8 | 12.0 | 10.3 | 17.8 | 12.4 | 0.0 | W | 6.8 | 20 | 2 | 1019.1 | 67.5 | 17.7 | 0 | 0 | 0 | 0 | 0 | 0 | 25 |
| 26 | 20.6 | 12.4 | 11.2 | 18.4 | 1.3 | 3.3 | S | 8.1 | 27 | 7 | 1015.1 | 76.3 | 16.2 | 0 | 0 | 0 | 0 | 0 | 0 | 26 |
| 27 | 20.8 | 13.0 | 12.7 | 18.1 | 3.6 | 4.3 | SW | 6.4 | 27 | 8 | 1010.2 | 82.0 | 15.3 | 0 | 0 | 0 | 0 | 0 | 0 | 27 |
| 28 | 21.4 | 10.9 | 9.5 | 17.9 | 8.3 | 0.8 | SW | 9.2 | 29 | 3 | 1015.2 | 67.9 | 16.3 | 0 | 0 | 0 | 0 | 0 | 0 | 28 |
| 29 | 19.7 | 13.8 | 12.7 | 18.0 | 0.4 | 6.1 | S | 6.8 | 33 | 8 | 1010.5 | 80.1 | 15.7 | 0 | 0 | 0 | 0 | 0 | 0 | 29 |
| 30 | 19.5 | 11.0 | 9.5 | 17.5 | 10.5 | 0.7 | W | 8.9 | 26 | 7 | 1016.5 | 72.2 | 14.7 | 0 | 0 | 0 | 0 | 0 | 1 | 30 |
| 31 | 21.5 | 10.7 | 7.8 | 17.4 | 8.3 | 0.2 | S | 4.3 | 19 | 2 | 1018.5 | 61.2 | 16.5 | 0 | 0 | 0 | 0 | 0 | 0 | 31 |
| Total/Mean | 22.2 | 12.8 | 11.4 | 18.8 | 210.2 | 68.9 | X | 7.1 | X | 5.4 | 1010.3 | 73.1 | 16.9 | 0 | 0 | 0 | 0 | 0 | 4 | Total/Mean |
| *Diff./% | -0.1 | +0.2 | 110% | 159% | *Diff./% | |||||||||||||||
| Date | Max. Temp. (°C) 09/09h | Min. Temp. (°C) 09/09h | Grass Min. Temp. (°C) 21/09h | Earth (30cms) Temp. (°C) 09h | Sun (Hours) 00/00h | R'fall (MM) 09/09h | Wind Dir'n 09h | Mean Wind Speed (MPH) 00/00h | Max. Gust Speed (MPH) 00/00h | Cloud Cover (Oktas) 09h | Mean MSL Air Pressure (mB) 00/00h | Mean Rel. Humd. (%) 00/00h | Mean Temp. (°C) 00/00h | Fog (vis. <1000m @ 09h) | Fog (vis. <200m @ 09h) | Snow or Rain and Snow 00/00h | Snow Lying @ 09h (>50% cover) | Hail 00/00h | Thunder 00/00h | Date |
Differences from average:
Differences from average shown in red. Reference periods used are as follows: Temperature 30 Years 1976/2005; rainfall 30 Years 1971/2000; sunshine 30 Years 1971/2000.
(*The differences from average quoted during the course of the month relate to the cumulative daily averages up to the date of the last observation, not the averages for the month as a whole)
Additional Data:
Rainfall Duration 51.2 hours
Air Frost Duration NIL hours
Graphs and Charts:
Click on the following links to view this month's graphs and charts.....
1. Daily Maximum, Minimum & Grass Minimum Temperatures
2. Daily Maximum & Minimum Temperatures (with 30 Year Comparative Means)
3. Daily Earth (30 cms Depth) Temperature @ 0900 GMT 4. Daily Rainfall 5. Daily Sunshine
6. Daily Maximum Gust & Mean Wind Speed 7. Daily Wind Direction @ 0900 GMT
8. Daily Mean MSL Air Pressure 9. Daily Mean Relative Humidity 10. Thermograph
11. Barograph 12. Hygrograph 13. Anemograph 14. Wind Direction
15. Sunshine Duration 16. Rainfall Intensity & Duration
July 2009 Weather Review:
......and click on the link below for a text report of the July 2009 weather in Royston
July (since 1972) at Royston (Iceni) Weather Station:
Mean day maximum temperature (30 years 1976/2005) 22.3°C
Mean night minimum temperature (30 years 1976/2005) 12.6°C
Highest temperature 35.2°C (19th July 2006); lowest temperature 6.4°C (30th July 1977)
Lowest grass minimum temperature 2.8°C (13th July 1993)
Hottest July 2006 (Mean temperature 21.5°C); coolest July 1978 (Mean temperature 15.2°C)
Average July rainfall (30 years 1971/2000) 43.2 mm
Wettest July 2002 (Rainfall 104.7 mm); driest July 1984 (Rainfall 8.3 mm)
Wettest Day 26th July 2006 (Rainfall 75.5 mm);
Highest number of "rain days" (0.2 mm or more) 20 (1988); lowest number of "rain days" 6 (1976,1977, 1979, 1984, & 1990)
Highest number of days with thunder 6 (1975, 1982,1983 & 2002)
|
|
|
|
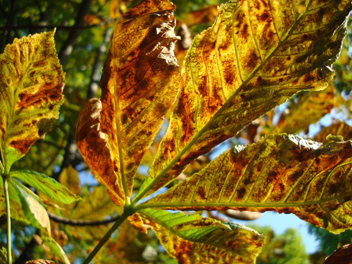
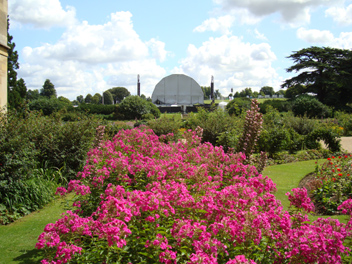
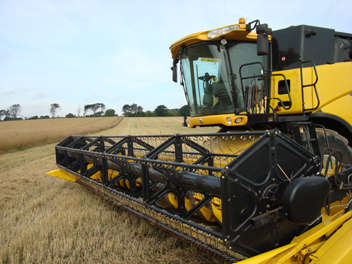
| This may at first sight look an attractive photograph but in reality it shows the damage done to a horse chestnut leaf (as seen on the Icknield Way E of Royston on 2nd July 2009) by the leaf miner moth, which has been responsible for horse chestnut trees suffering this problem every Summer and Autumn since 2002. The moths lay their eggs in the leaves and when they hatch the caterpillars eat the host leaves from the inside. It appears that these attacks do not do any permanent damage to the trees themselves and the conkers do not appear to be adversely affected, but discoloured horse chestnut trees are now a familiar sight annually all over the district once the Summer arrives. This day turned out to be the sunniest day of July with sunshine of 14.7 hours, and with a maximum temperature of 28.5°C was the second hottest day of the month (after 29.1°C on 1st). | This view (at 1042 GMT on 25th July 2009) is from Audley End House (17 km ESE of Royston) across the 1830's created Parterre Garden towards the Ha-ha (a ditch) and grassy area beyond. In the background can be seen the rear of the temporary stage which has been erected for the series of Audley End Picnic Concerts providing music on Summer evenings. The land beyond the stage slopes gently upwards to the Temple of Concord and is an ideal location for a picnic and listening to the music. Artists booked for evening concerts this year include favourites such as Russell Watson, Will Young and Katherine Jenkins. The Will Young concert on this day benefitted from a ridge of high pressure crossing the country giving a fine day and evening free from the showers of the previous few days, and a maximum temperature for the day (at Royston) of 23.8°C. | Machines such as this combine harvester as seen at Lowerfield to the E of Royston on 26th July 2009 are a common sight around Royston at this time of the year as the harvest of mainly barley, wheat and oats is gathered in. The harvest started in earnest in this area two days previously and this New Holland harvester here awaits its next duty in completing the combining of the barley in this field. The tree belt in the distance suffered severe damage during harvesting on 19th July 2006 (the hottest day of the year with a maximum temperature of 35.2°C) when a serious fire broke out destroying 40 acres of crops. When this photograph was taken the temperature was somewhat lower at 14.5°C in a S wind of mean speed 6 knots gusting to 10 knots. Rain on most days of the previous week and again on 26th/27th clearly posed a challenge for successful harvesting operations. |
Return to Welcome to Royston (Iceni) Weather Station page
(This page last updated 15th August 2009 2022 GMT)