Royston (Iceni) Weather Station
Daily Weather Observations - June 2009
(All Times GMT)
| Date | Max. Temp. (°C) 09/09h | Min. Temp. (°C) 09/09h | Grass Min. Temp. (°C) 21/09h | Earth (30cms) Temp. (°C) 09h | Sun (Hours) 00/00h | R'fall (MM) 09/09h | Wind Dir'n 09h | Mean Wind Speed (MPH) 00/00h | Max. Gust Speed (MPH) 00/00h | Cloud Cover (Oktas) 09h | Mean MSL Air Pressure (mB) 00/00h | Mean Rel. Humd. (%) 00/00h | Mean Temp. (°C) 00/00h | Fog (vis. <1000m @ 09h) | Fog (vis. <200m @ 09h) | Snow or Rain and Snow 00/00h | Snow Lying @ 09h (>50% cover) | Hail 00/00h | Thunder 00/00h | Date |
| 1 | 26.0 | 9.0 | 6.4 | 16.9 | 15.5 | 0.0 | NE | 4.0 | 22 | 1 | 1025.2 | 67.1 | 16.8 | 0 | 0 | 0 | 0 | 0 | 0 | 1 |
| 2 | 25.3 | 8.2 | 5.1 | 17.1 | 15.4 | 0.0 | NE | 3.2 | 16 | 0 | 1024.4 | 60.2 | 17.1 | 0 | 0 | 0 | 0 | 0 | 0 | 2 |
| 3 | 15.9 | 10.0 | 6.9 | 17.6 | 2.4 | 0.0 | NE | 3.5 | 17 | 8 | 1021.6 | 72.8 | 12.6 | 0 | 0 | 0 | 0 | 0 | 0 | 3 |
| 4 | 18.5 | 4.7 | 1.5 | 16.5 | 9.1 | 0.2 | NW | 2.5 | 15 | 6 | 1017.8 | 67.7 | 11.4 | 0 | 0 | 0 | 0 | 0 | 0 | 4 |
| 5 | 13.5 | 8.9 | 8.2 | 16.5 | 0.2 | 3.5 | SE | 3.4 | 15 | 8 | 1009.1 | 82.0 | 10.3 | 0 | 0 | 0 | 0 | 0 | 0 | 5 |
| 6 | 15.9 | 8.5 | 8.0 | 15.7 | 0.1 | 12.3 | E | 3.8 | 17 | 8 | 1001.9 | 74.4 | 11.4 | 0 | 0 | 0 | 0 | 0 | 0 | 6 |
| 7 | 17.0 | 6.9 | 6.5 | 15.6 | 3.8 | 10.1 | NW | 2.9 | 21 | 8 | 1000.2 | 86.6 | 10.6 | 0 | 0 | 0 | 0 | 0 | 0 | 7 |
| 8 | 17.0 | 7.9 | 4.8 | 15.4 | 2.6 | 2.3 | NE | 3.1 | 15 | 7 | 1005.3 | 80.9 | 12.2 | 0 | 0 | 0 | 0 | 0 | 0 | 8 |
| 9 | 15.6 | 10.0 | 8.4 | 15.5 | 0.1 | 0.7 | N | 2.8 | 13 | 8 | 1005.7 | 85.5 | 12.5 | 0 | 0 | 0 | 0 | 0 | 0 | 9 |
| 10 | 16.2 | 10.9 | 10.3 | 15.4 | 0.2 | 8.0 | E | 1.5 | 16 | 8 | 1009.1 | 88.8 | 12.6 | 0 | 0 | 0 | 0 | 0 | 0 | 10 |
| 11 | 18.8 | 11.0 | 11.0 | 15.4 | 6.2 | 0.1 | NW | 6.0 | 21 | 6 | 1014.8 | 75.9 | 13.5 | 0 | 0 | 0 | 0 | 0 | 0 | 11 |
| 12 | 20.6 | 6.6 | 3.5 | 15.8 | 13.0 | 0.0 | NW | 3.2 | 13 | 3 | 1019.7 | 61.4 | 14.5 | 0 | 0 | 0 | 0 | 0 | 0 | 12 |
| 13 | 23.7 | 13.5 | 12.6 | 16.9 | 7.8 | 0.2 | SW | 6.0 | 20 | 2 | 1017.5 | 67.8 | 18.3 | 0 | 0 | 0 | 0 | 0 | 0 | 13 |
| 14 | 24.4 | 13.0 | 11.1 | 17.9 | 14.2 | 0.0 | NW | 4.6 | 15 | 1 | 1016.4 | 62.7 | 17.8 | 0 | 0 | 0 | 0 | 0 | 0 | 14 |
| 15 | 23.5 | 12.4 | 10.0 | 18.2 | 5.4 | 2.1 | N | 3.3 | 19 | 7 | 1014.3 | 73.3 | 16.1 | 0 | 0 | 0 | 0 | 0 | 1 | 15 |
| 16 | 22.9 | 9.7 | 7.7 | 18.2 | 11.0 | 0.0 | NW | 3.2 | 13 | 4 | 1020.6 | 72.3 | 16.0 | 0 | 0 | 0 | 0 | 0 | 0 | 16 |
| 17 | 20.9 | 10.9 | 9.5 | 18.5 | 3.4 | 0.1 | S | 9.5 | 33 | 6 | 1015.5 | 69.7 | 16.1 | 0 | 0 | 0 | 0 | 0 | 0 | 17 |
| 18 | 18.8 | 10.7 | 9.0 | 17.9 | 6.2 | 0.0 | W | 9.0 | 27 | 4 | 1015.7 | 67.3 | 14.7 | 0 | 0 | 0 | 0 | 0 | 0 | 18 |
| 19 | 19.5 | 9.7 | 8.1 | 17.4 | 7.2 | TR | W | 9.2 | 27 | 4 | 1018.7 | 65.2 | 14.4 | 0 | 0 | 0 | 0 | 0 | 0 | 19 |
| 20 | 18.5 | 10.9 | 9.0 | 17.3 | 1.9 | TR | W | 10.3 | 21 | 5 | 1021.9 | 72.0 | 14.1 | 0 | 0 | 0 | 0 | 0 | 0 | 20 |
| 21 | 22.1 | 10.5 | 8.1 | 17.0 | 4.0 | 0.0 | NW | 4.8 | 17 | 6 | 1023.0 | 72.2 | 15.2 | 0 | 0 | 0 | 0 | 0 | 0 | 21 |
| 22 | 21.0 | 12.1 | 10.7 | 17.5 | 1.5 | 0.0 | SW | 3.9 | 14 | 5 | 1026.1 | 68.4 | 16.3 | 0 | 0 | 0 | 0 | 0 | 0 | 22 |
| 23 | 24.2 | 12.5 | 11.1 | 17.8 | 12.5 | 0.0 | SE | 3.5 | 15 | 2 | 1026.9 | 60.8 | 17.5 | 0 | 0 | 0 | 0 | 0 | 0 | 23 |
| 24 | 24.9 | 7.3 | 4.4 | 18.0 | 13.8 | 0.0 | NE | 4.6 | 20 | 0 | 1021.3 | 69.2 | 16.1 | 0 | 0 | 0 | 0 | 0 | 0 | 24 |
| 25 | 26.2 | 11.1 | 8.5 | 18.6 | 9.8 | 0.0 | NE | 3.9 | 19 | 5 | 1013.5 | 70.7 | 18.6 | 0 | 0 | 0 | 0 | 0 | 0 | 25 |
| 26 | 23.1 | 12.4 | 10.4 | 19.0 | 2.2 | 17.3 | NE | 3.1 | 17 | 7 | 1010.9 | 84.8 | 17.8 | 0 | 0 | 0 | 0 | 0 | 1 | 26 |
| 27 | 24.2 | 15.3 | 13.5 | 19.1 | 6.3 | 0.2 | W | 3.1 | 13 | 8 | 1014.1 | 80.3 | 18.8 | 0 | 0 | 0 | 0 | 0 | 0 | 27 |
| 28 | 24.7 | 14.0 | 11.4 | 19.2 | 4.4 | 0.0 | NE | 1.6 | 10 | 8 | 1014.7 | 77.6 | 19.1 | 0 | 0 | 0 | 0 | 0 | 0 | 28 |
| 29 | 28.8 | 15.3 | 12.5 | 19.5 | 15.1 | 0.0 | SE | 3.5 | 15 | 2 | 1017.2 | 64.7 | 21.6 | 0 | 0 | 0 | 0 | 0 | 0 | 29 |
| 30 | 29.0 | 14.6 | 12.8 | 20.2 | 15.5 | 0.0 | E | 3.4 | 14 | 0 | 1020.5 | 67.8 | 21.5 | 0 | 0 | 0 | 0 | 0 | 0 | 30 |
| Total/Mean | 21.4 | 10.6 | 8.7 | 17.4 | 210.6 | 57.1 | X | 4.3 | X | 4.9 | 1016.1 | 72.3 | 15.5 | 0 | 0 | 0 | 0 | 0 | 2 | Total/Mean |
| *Diff./% | +1.5 | 0.0 | 117% | 114% | *Diff./% | |||||||||||||||
| Date | Max. Temp. (°C) 09/09h | Min. Temp. (°C) 09/09h | Grass Min. Temp. (°C) 21/09h | Earth (30cms) Temp. (°C) 09h | Sun (Hours) 00/00h | R'fall (MM) 09/09h | Wind Dir'n 09h | Mean Wind Speed (MPH) 00/00h | Max. Gust Speed (MPH) 00/00h | Cloud Cover (Oktas) 09h | Mean MSL Air Pressure (mB) 00/00h | Mean Rel. Humd. (%) 00/00h | Mean Temp. (°C) 00/00h | Fog (vis. <1000m @ 09h) | Fog (vis. <200m @ 09h) | Snow or Rain and Snow 00/00h | Snow Lying @ 09h (>50% cover) | Hail 00/00h | Thunder 00/00h | Date |
Differences from average:
Differences from average shown in red. Reference periods used are as follows: Temperature 30 Years 1976/2005; rainfall 30 Years 1971/2000; sunshine 30 Years 1971/2000.
(*The differences from average quoted during the course of the month relate to the cumulative daily averages up to the date of the last observation, not the averages for the month as a whole)
Additional Data:
Rainfall Duration 21.3 hours
Air Frost Duration NIL hours
Graphs and Charts:
Click on the following links to view this month's graphs and charts.....
1. Daily Maximum, Minimum & Grass Minimum Temperatures
2. Daily Maximum & Minimum Temperatures (with 30 Year Comparative Means)
3. Daily Earth (30 cms Depth) Temperature @ 0900 GMT 4. Daily Rainfall 5. Daily Sunshine
6. Daily Maximum Gust & Mean Wind Speed 7. Daily Wind Direction @ 0900 GMT
8. Daily Mean MSL Air Pressure 9. Daily Mean Relative Humidity 10. Thermograph
11. Barograph 12. Hygrograph 13. Anemograph 14. Wind Direction
15. Sunshine Duration 16. Rainfall Intensity & Duration
June 2009 Weather Review:
......and click on the link below for a text report of the June 2009 weather in Royston
June (since 1972) at Royston (Iceni) Weather Station:
Mean daily maximum temperature (30 years 1976/2005) 19.9°C
Mean daily minimum temperature (30 years 1976/2005) 10.6°C
Highest temperature 33.7°C (26th June 1976); lowest temperature 2.2°C (3rd June 1975)
Lowest grass minimum temperature -1.0°C (2nd June 1991)
Warmest June 1976 (Mean temperature 18.3°C); coldest June 1977 (Mean temperature 12.5°C)
Average June rainfall (30 years 1971/2000) 50.2 mm
Wettest June 1985 (Rainfall 135.4 mm); driest June 1996 (Rainfall 8.0 mm)
Wettest Day 19th June 1973 (Rainfall 36.8 mm);
Highest number of "rain days" (0.2 mm or more) 23 (1997); lowest number of "rain days" 3 (1976, 1996)
Highest number of days with thunder 10 (1982)
Highest number of air frosts 0
Highest number of ground frosts 2 (1989)
Highest number of days with snow falling 1 (1975)
Highest number of days with snow lying (ground with more than 50% snow cover @ 0900 GMT) 0
|
|
|
|
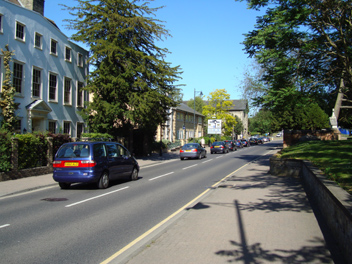
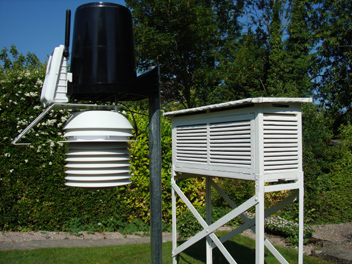
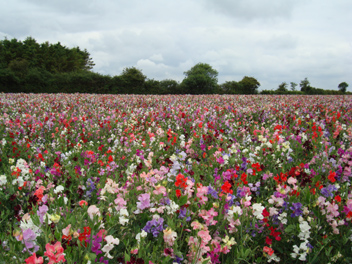
| This view is looking eastwards along Melbourn Street, Royston on 2nd June 2009 at 1549 GMT. Out of view to the right and left are the 12th Century Church of St. John the Baptist and the Banyers Hotel respectively, whilst further along the street on the left are the Police Station and the Town Hall. The War Memorial is close to the large tree on the right, and at the end of the street is the Town Hall roundabout. Most heavy traffic was removed from this road in 1982 with the construction of the A505 Royston by-pass, although fears remain for the well being of the Royston Cave which is situated under the road some distance behind the photographer. The temperature at this time was 24.2°C (after a daily maximum of 25.3°C), and sunshine for the day was 15.4 hours. | Situated close to the Stevenson Screen at Royston (Iceni) Weather Station is a fan-aspirated radiation shield (FARS) containing temperature and humidity sensors. To counter the effects of solar radiation on the FARS and its internal sensors, air is drawn through the FARS by a 24 hour solar powered fan which varies its speed according to ambient conditions. Two solar panels provide power for the fan and for wireless transmission of the data to a remote datalogger. An automatic rain gauge is mounted on top of the FARS as shown but as the rim of the gauge is above the UKMO regulation height of 30 cms its readings are not included in station data. The perspective of the photograph exaggerates the height of these instruments; they are in fact at a similar elevation to the Stevenson Screen. | On 21st June 2009 a party from the Royston Allotments & Gardens Association visited Kings Seeds at Monks Farm, Kelvedon, Essex (52 km ESE of Royston). This part of Essex has over the years been a traditional location of vegetable and other seed production in Great Britain due to its favourable climate for this purpose, although this activity has declined in recent years. Association members were given a very informative tour of the Kings premises encompassing all stages of seed production and packaging, including the laboratory where, inter alia, seed germination is tested. The picture above (at 1020 GMT) shows a large area of sweet peas which will later be combined and the seeds gathered for packaging and distribution, whilst off the picture to the right sweet pea seed trials are being undertaken. |
Return to Welcome to Royston (Iceni) Weather Station page
(This page last updated 10th July 2009 2027 GMT)