
Royston (Iceni) Weather Station
Daily Weather Observations - March 2009
(All Times GMT)
| Date | Max. Temp. (°C) 09/09h | Min. Temp. (°C) 09/09h | Grass Min. Temp. (°C) 21/09h | Earth (30cms) Temp. (°C) 09h | Sun (Hours) 00/00h | R'fall (MM) 09/09h | Wind Dir'n 09h | Mean Wind Speed (MPH) 00/00h | Max. Gust Speed (MPH) 00/00h | Cloud Cover (Oktas) 09h | Mean MSL Air Pressure (mB) 00/00h | Mean Rel. Humd. (%) 00/00h | Mean Temp. (°C) 00/00h | Fog (vis. <1000m @ 09h) | Fog (vis. <200m @ 09h) | Snow or Rain and Snow 00/00h | Snow Lying @ 09h (>50% cover) | Hail 00/00h | Thunder 00/00h | Date |
| 1 | 10.0 | 1.9 | -2.3 | 6.6 | 0.3 | 0.0 | S | 2.6 | 16 | 8 | 1005.8 | 87.6 | 5.9 | 0 | 0 | 0 | 0 | 0 | 0 | 1 |
| 2 | 11.5 | 1.6 | -1.1 | 6.3 | 7.8 | 0.0 | NW | 6.2 | 23 | 0 | 1012.1 | 81.3 | 6.2 | 0 | 0 | 0 | 0 | 0 | 0 | 2 |
| 3 | 10.9 | 5.4 | 3.7 | 6.2 | 1.6 | 9.9 | SW | 10.8 | 48 | 8 | 998.4 | 90.7 | 7.4 | 0 | 0 | 0 | 0 | 0 | 0 | 3 |
| 4 | 7.5 | 3.0 | 2.3 | 6.5 | 5.1 | 0.0 | W | 2.8 | 14 | 5 | 979.0 | 84.1 | 4.3 | 0 | 0 | 0 | 0 | 0 | 0 | 4 |
| 5 | 8.6 | -1.7 | -5.5 | 6.0 | 7.0 | 0.0 | E | 2.1 | 16 | 2 | 990.3 | 86.5 | 2.5 | 0 | 0 | 0 | 0 | 0 | 0 | 5 |
| 6 | 10.1 | -1.0 | -4.0 | 5.4 | 9.5 | 0.0 | W | 4.2 | 21 | 0 | 1003.4 | 82.5 | 4.2 | 0 | 0 | 0 | 0 | 0 | 0 | 6 |
| 7 | 12.5 | 5.1 | 2.4 | 5.4 | 2.9 | 0.8 | W | 7.6 | 35 | 7 | 1005.4 | 84.2 | 8.7 | 0 | 0 | 0 | 0 | 0 | 0 | 7 |
| 8 | 10.2 | 4.5 | 1.9 | 6.4 | 6.8 | 3.1 | W | 12.3 | 41 | 0 | 998.9 | 81.2 | 5.9 | 0 | 0 | 1 | 0 | 1 | 0 | 8 |
| 9 | 10.6 | 2.0 | 0.4 | 6.0 | 5.7 | 6.2 | W | 12.0 | 39 | 1 | 1006.3 | 75.3 | 5.9 | 0 | 0 | 0 | 0 | 0 | 0 | 9 |
| 10 | 9.5 | 5.4 | 4.5 | 6.0 | 1.2 | 1.0 | NW | 6.0 | 30 | 8 | 1007.3 | 94.2 | 6.5 | 0 | 0 | 0 | 0 | 0 | 0 | 10 |
| 11 | 13.1 | 1.5 | -1.7 | 6.0 | 8.3 | 0.0 | W | 4.3 | 18 | 2 | 1019.7 | 87.5 | 7.4 | 0 | 0 | 0 | 0 | 0 | 0 | 11 |
| 12 | 12.4 | 8.7 | 7.9 | 6.7 | 0.1 | 0.1 | W | 8.3 | 30 | 8 | 1017.2 | 90.5 | 9.7 | 0 | 0 | 0 | 0 | 0 | 0 | 12 |
| 13 | 12.0 | 5.1 | 3.0 | 7.0 | 0.9 | 0.3 | SW | 4.4 | 21 | 8 | 1016.7 | 89.3 | 7.9 | 0 | 0 | 0 | 0 | 0 | 0 | 13 |
| 14 | 13.0 | 5.5 | 4.0 | 7.3 | 2.5 | 0.0 | W | 7.8 | 30 | 8 | 1014.0 | 76.7 | 8.9 | 0 | 0 | 0 | 0 | 0 | 0 | 14 |
| 15 | 15.6 | 4.5 | 1.5 | 7.4 | 8.2 | 0.0 | W | 3.8 | 18 | 1 | 1027.4 | 75.2 | 9.0 | 0 | 0 | 0 | 0 | 0 | 0 | 15 |
| 16 | 16.6 | 4.9 | -0.4 | 7.5 | 10.6 | 0.0 | SW | 3.0 | 16 | 1 | 1029.2 | 74.0 | 10.7 | 0 | 0 | 0 | 0 | 0 | 0 | 16 |
| 17 | 13.1 | 4.2 | 0.0 | 7.8 | 4.0 | 0.0 | NE | 1.7 | 16 | 4 | 1033.1 | 87.7 | 7.4 | 0 | 0 | 0 | 0 | 0 | 0 | 17 |
| 18 | 15.5 | 2.0 | -1.5 | 7.6 | 11.4 | 0.0 | S | 1.4 | 12 | 1 | 1029.5 | 79.3 | 7.8 | 0 | 0 | 0 | 0 | 0 | 0 | 18 |
| 19 | 12.0 | 2.0 | -2.4 | 7.5 | 4.4 | 0.0 | E | 1.7 | 18 | 8 | 1027.1 | 88.7 | 5.7 | 1 | 1 | 0 | 0 | 0 | 0 | 19 |
| 20 | 12.4 | 4.1 | 2.8 | 7.7 | 7.8 | 0.0 | SE | 2.0 | 14 | 6 | 1029.7 | 80.8 | 6.6 | 0 | 0 | 0 | 0 | 0 | 0 | 20 |
| 21 | 15.9 | 2.9 | -0.2 | 7.8 | 11.3 | 0.0 | NW | 5.0 | 16 | 0 | 1027.3 | 75.8 | 8.5 | 0 | 0 | 0 | 0 | 0 | 0 | 21 |
| 22 | 15.0 | 3.5 | -1.0 | 8.0 | 9.4 | 0.0 | NW | 5.6 | 30 | 1 | 1027.7 | 80.5 | 8.8 | 0 | 0 | 0 | 0 | 0 | 0 | 22 |
| 23 | 11.8 | 6.1 | 2.6 | 8.3 | 2.9 | 2.3 | W | 13.4 | 44 | 6 | 1013.7 | 77.4 | 7.4 | 0 | 0 | 0 | 0 | 0 | 0 | 23 |
| 24 | 12.0 | 2.3 | -0.2 | 7.7 | 5.7 | 3.0 | N | 8.5 | 35 | 7 | 1012.9 | 70.0 | 6.5 | 0 | 0 | 0 | 0 | 0 | 0 | 24 |
| 25 | 11.9 | 5.5 | 3.6 | 8.0 | 3.9 | 1.0 | NW | 12.4 | 41 | 7 | 1001.3 | 83.1 | 7.7 | 0 | 0 | 0 | 0 | 1 | 0 | 25 |
| 26 | 14.0 | 6.1 | 3.9 | 7.9 | 4.5 | 1.1 | W | 10.2 | 44 | 7 | 998.3 | 79.4 | 8.5 | 0 | 0 | 0 | 0 | 1 | 0 | 26 |
| 27 | 10.1 | 3.4 | 1.8 | 8.0 | 5.1 | 1.5 | W | 10.1 | 35 | 7 | 993.9 | 74.1 | 5.9 | 0 | 0 | 0 | 0 | 0 | 0 | 27 |
| 28 | 9.7 | 2.8 | 0.9 | 7.5 | 1.0 | 1.3 | NW | 4.7 | 41 | 8 | 997.0 | 88.1 | 4.5 | 0 | 0 | 0 | 0 | 1 | 0 | 28 |
| 29 | 9.5 | -0.5 | -4.0 | 7.4 | 6.8 | 0.0 | NW | 1.8 | 14 | 5 | 1010.9 | 71.9 | 4.1 | 0 | 0 | 0 | 0 | 0 | 0 | 29 |
| 30 | 12.8 | 1.4 | -2.0 | 7.3 | 5.3 | 0.0 | SW | 5.0 | 21 | 1 | 1017.7 | 71.5 | 7.8 | 0 | 0 | 0 | 0 | 0 | 0 | 30 |
| 31 | 14.0 | 8.4 | 7.0 | 7.9 | 0.9 | 0.0 | NW | 1.0 | 12 | 7 | 1021.1 | 74.8 | 10.4 | 0 | 0 | 0 | 0 | 0 | 0 | 31 |
| Total/Mean | 12.1 | 3.6 | 0.9 | 7.1 | 162.4 | 31.6 | X | 5.9 | X | 4.6 | 1012.0 | 81.4 | 7.1 | 1 | 1 | 1 | 0 | 4 | 0 | Total/Mean |
| *Diff./% | +1.7 | +0.1 | 152% | 74% | *Diff./% | |||||||||||||||
| Date | Max. Temp. (°C) 09/09h | Min. Temp. (°C) 09/09h | Grass Min. Temp. (°C) 21/09h | Earth (30cms) Temp. (°C) 09h | Sun (Hours) 00/00h | R'fall (MM) 09/09h | Wind Dir'n 09h | Mean Wind Speed (MPH) 00/00h | Max. Gust Speed (MPH) 00/00h | Cloud Cover (Oktas) 09h | Mean MSL Air Pressure (mB) 00/00h | Mean Rel. Humd. (%) 00/00h | Mean Temp. (°C) 00/00h | Fog (vis. <1000m @ 09h) | Fog (vis. <200m @ 09h) | Snow or Rain and Snow 00/00h | Snow Lying @ 09h (>50% cover) | Hail 00/00h | Thunder 00/00h | Date |
Differences from average:
Differences from average shown in red. Reference periods used are as follows: Temperature 30 Years 1976/2005; rainfall 30 Years 1971/2000; sunshine 30 Years 1971/2000.
(*The differences from average quoted during the course of the month relate to the cumulative daily averages up to the date of the last observation, not the averages for the month as a whole)
Additional Data:
Rainfall Duration 26.1 hours
Air Frost Duration 12.3 hours
Graphs and Charts:
Click on the following links to view this month's graphs and charts.....
1. Daily Maximum, Minimum & Grass Minimum Temperatures
2. Daily Maximum & Minimum Temperatures (with 30 Year Comparative Means)
3. Daily Earth (30 cms Depth) Temperature @ 0900 GMT 4. Daily Rainfall 5. Daily Sunshine
6. Daily Maximum Gust & Mean Wind Speed 7. Daily Wind Direction @ 0900 GMT
8. Daily Mean MSL Air Pressure 9. Daily Mean Relative Humidity 10. Thermograph
11. Barograph 12. Hygrograph 13. Anemograph 14. Wind Direction
15. Sunshine Duration 16. Rainfall Intensity & Duration
March 2009 Weather Review:
......and click on the link below for a text report of the March 2009 weather in Royston
March (since 1973) at Royston (Iceni) Weather Station:
Mean day maximum temperature (30 years 1976/2005) 10.4°C
Mean night minimum temperature (30 years 1976/2005) 3.5°C
Highest temperature 21.6°C (17th March 1990); lowest temperature -6.6°C (3rd March 1986)
Lowest grass minimum temperature -13.7°C (3rd March 1986)
Warmest March 1997 (Mean temperature 9.1°C); coldest March 1987 (Mean temperature 4.3°C)
Average March rainfall (30 years 1971/2000) 42.5 mm
Wettest March 1979 (Rainfall 97.8 mm); driest March 1997 (Rainfall 8.1 mm)
Wettest Day 2nd March 1995 (Rainfall 30.1 mm);
Highest number of "rain days" (0.2 mm or more) 25 (1981); lowest number of "rain days" 3 (2003)
Highest number of days with thunder 2 (1986, 1995)
Highest number of air frosts 15 (1987)
Highest number of ground frosts 21 (1987)
Highest number of days with snow falling 11 (1979)
Highest number of days with snow lying (ground with more than 50% snow cover @ 0900 GMT) 4 (1986)
|
|
|
|
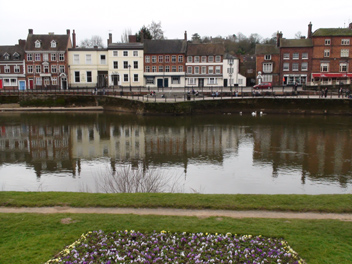
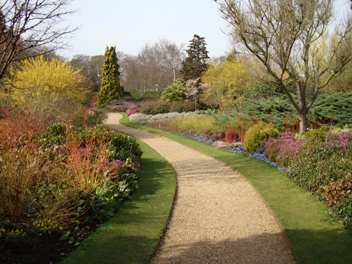
| Although built on chalk and with no surface drainage Royston has occasionally experienced temporary localised flooding events during periods of exceptionally heavy rainfall, but nothing on the scale of the serious flooding suffered at the above location at various times over the years. This is the River Severn at Bewdley, Worcestershire (158 km WNW of Royston) just downstream from the B4190 Load Street bridge in the centre of the town, as seen at 1310 GMT on 7th March 2009 during rather dull conditions. The river is fairly low on this date but has been seen at an even lower level on occasions. Just to the right of the picture, on the river bank the other side of the bridge is a large measuring column for recording water levels. | The Winter Garden in the University Botanic Garden in Cambridge (21 km NE of Royston) is resplendent at this time of the year (16th March 2009 at 1142 GMT), with only a fraction of the colour available being visible in this picture. Close to this location the University is undertaking a large construction project, the Sainsbury Laboratory which will be home to 120 scientists and 30 support staff dedicated to establishing how plant diversity arises and evolves. At the heart of this laboratory will be the University Herbarium which contains over 1 million dressed and dried plant specimens from all over the world, including those collected by Darwin on the Beagle voyage. The laboratory is due to be occupied in early 2011. | This picture shows a highly unusual situation with no visible traffic on the A10 London to Kings Lynn road as it passes just to the north of the Town Hall roundabout in Royston! Given that this is 0948 GMT on a weekday (Friday, 27th March 2009) the absence of any traffic is even more puzzling. However, this is a freak photograph as the road was very busy as usual at the time but the photographer just happened to catch a temporary lull in the traffic flow (lasting no more than a few seconds!). The daffodils gracing the grass verge are being buffeted by a strong NW wind of mean speed 12 knots gusting to 28 knots, in a temperature of 7.7°C. The day was cooler than normal with the maximum temperature reaching 10.1°C (1.2°C below the 30 Year (1976/2205) average for this date). |
Return to Welcome to Royston (Iceni) Weather Station page
(This page last updated 8th April 2009 2005 GMT)