

Royston (Iceni) Weather Station
Daily Weather Observations - FEBRUARY 2009
(All Times GMT)
| Date | Max. Temp. (°C) 09/09h | Min. Temp. (°C) 09/09h | Grass Min. Temp. (°C) 21/09h | Earth (30cms) Temp. (°C) 09h | Sun (Hours) 00/00h | R'fall (MM) 09/09h | Wind Dir'n 09h | Mean Wind Speed (MPH) 00/00h | Max. Gust Speed (MPH) 00/00h | Cloud Cover (Oktas) 09h | Mean MSL Air Pressure (mB) 00/00h | Mean Rel. Humd. (%) 00/00h | Mean Temp. (°C) 00/00h | Fog (vis. <1000m @ 09h) | Fog (vis. <200m @ 09h) | Snow or Rain and Snow 00/00h | Snow Lying @ 09h (>50% cover) | Hail 00/00h | Thunder 00/00h | Date |
| 1 | 2.9 | 0.4 | -1.1 | 3.6 | 3.4 | 3.3 | E | 5.9 | 30 | 8 | 1009.1 | 80.6 | -0.3 | 0 | 0 | 1 | 0 | 0 | 0 | 1 |
| 2 | 1.6 | -3.4 | -6.0 | 3.4 | 0.0 | 5.8 | NE | 3.4 | 21 | 8 | 995.2 | 99.7 | -1.2 | 0 | 0 | 1 | 1 | 0 | 0 | 2 |
| 3 | 3.0 | -4.5 | -9.0 | 3.3 | 7.0 | 0.0 | SE | 2.7 | 23 | 1 | 994.0 | 93.7 | -0.8 | 0 | 0 | 0 | 1 | 0 | 0 | 3 |
| 4 | 4.4 | -2.2 | -6.0 | 3.0 | 5.7 | 5.9 | S | 1.6 | 16 | 1 | 992.2 | 89.4 | -0.3 | 0 | 0 | 0 | 1 | 0 | 0 | 4 |
| 5 | 1.9 | -1.9 | -6.1 | 3.0 | 0.0 | 7.0 | CALM | 1.1 | 14 | 8 | 987.0 | 98.8 | 0.5 | 0 | 0 | 1 | 1 | 0 | 0 | 5 |
| 6 | 0.6 | 0.0 | -0.3 | 3.0 | 0.0 | 6.7 | NE | 2.0 | 14 | 8 | 988.9 | 98.4 | 0.0 | 0 | 0 | 1 | 1 | 0 | 0 | 6 |
| 7 | 3.4 | -4.2 | -6.4 | 2.9 | 4.7 | 0.0 | W | 4.8 | 18 | 8 | 994.0 | 92.1 | -0.8 | 1 | 0 | 0 | 1 | 0 | 0 | 7 |
| 8 | 4.2 | -2.0 | -6.5 | 2.9 | 2.5 | 3.3 | SW | 3.1 | 21 | 8 | 999.9 | 89.4 | 0.5 | 0 | 0 | 1 | 1 | 0 | 0 | 8 |
| 9 | 3.4 | -0.3 | -3.0 | 2.9 | 0.0 | 19.6 | S | 4.0 | 21 | 8 | 991.7 | 99.4 | 1.5 | 0 | 0 | 1 | 1 | 0 | 0 | 9 |
| 10 | 4.4 | 0.0 | -0.3 | 2.7 | 0.3 | 0.0 | NW | 8.0 | 35 | 8 | 997.1 | 92.4 | 1.2 | 0 | 0 | 1 | 1 | 0 | 0 | 10 |
| 11 | 4.9 | -0.6 | -5.0 | 2.5 | 4.2 | 0.0 | W | 4.7 | 23 | 1 | 1014.9 | 93.3 | 1.5 | 0 | 0 | 0 | 1 | 0 | 0 | 11 |
| 12 | 3.5 | -3.4 | -6.5 | 2.5 | 4.6 | 10.4 | W | 3.7 | 21 | 1 | 1021.7 | 91.3 | -0.4 | 0 | 0 | 1 | 1 | 0 | 0 | 12 |
| 13 | 5.7 | 0.3 | -0.1 | 2.3 | 4.8 | 0.0 | N | 2.7 | 18 | 7 | 1020.6 | 95.5 | 1.7 | 0 | 0 | 0 | 1 | 0 | 0 | 13 |
| 14 | 6.9 | -1.5 | -6.6 | 2.3 | 5.4 | 0.0 | N | 0.9 | 14 | 7 | 1026.3 | 82.3 | 1.7 | 0 | 0 | 0 | 1 | 0 | 0 | 14 |
| 15 | 6.6 | 2.5 | 1.1 | 2.3 | 0.1 | 0.8 | W | 6.2 | 23 | 8 | 1024.4 | 90.8 | 4.5 | 0 | 0 | 0 | 1 | 0 | 0 | 15 |
| 16 | 10.2 | 3.5 | 1.2 | 2.5 | 3.1 | 0.0 | W | 5.6 | 21 | 7 | 1022.5 | 88.9 | 6.3 | 0 | 0 | 0 | 0 | 0 | 0 | 16 |
| 17 | 11.0 | 4.6 | 2.5 | 2.9 | 0.1 | 0.5 | NW | 4.2 | 21 | 8 | 1023.1 | 93.9 | 7.9 | 0 | 0 | 0 | 0 | 0 | 0 | 17 |
| 18 | 8.5 | 6.1 | 4.5 | 4.0 | 0.0 | 0.3 | CALM | 0.4 | 9 | 8 | 1024.3 | 96.5 | 6.9 | 0 | 0 | 0 | 0 | 0 | 0 | 18 |
| 19 | 10.4 | 5.5 | 4.7 | 4.7 | 3.1 | 0.2 | NW | 2.6 | 18 | 6 | 1024.8 | 90.1 | 7.1 | 0 | 0 | 0 | 0 | 0 | 0 | 19 |
| 20 | 7.5 | 4.9 | 2.8 | 5.1 | 0.6 | 0.0 | NW | 2.0 | 14 | 8 | 1028.9 | 92.5 | 5.7 | 0 | 0 | 0 | 0 | 0 | 0 | 20 |
| 21 | 12.2 | 3.8 | 1.3 | 5.3 | 9.7 | 0.0 | NW | 4.7 | 18 | 1 | 1028.2 | 83.2 | 7.0 | 0 | 0 | 0 | 0 | 0 | 0 | 21 |
| 22 | 10.3 | 5.0 | 3.4 | 5.0 | 0.1 | 0.3 | W | 6.3 | 25 | 7 | 1024.0 | 84.8 | 7.4 | 0 | 0 | 0 | 0 | 0 | 0 | 22 |
| 23 | 10.1 | 5.0 | 2.6 | 5.5 | 0.0 | 0.5 | NW | 3.4 | 18 | 8 | 1021.9 | 92.8 | 7.4 | 0 | 0 | 0 | 0 | 0 | 0 | 23 |
| 24 | 10.2 | 6.8 | 4.5 | 6.0 | 0.0 | 0.2 | NW | 0.7 | 12 | 8 | 1024.7 | 97.0 | 8.2 | 0 | 0 | 0 | 0 | 0 | 0 | 24 |
| 25 | 10.3 | 7.5 | 7.0 | 6.4 | 1.2 | TR | W | 5.5 | 21 | 8 | 1024.4 | 91.2 | 8.0 | 0 | 0 | 0 | 0 | 0 | 0 | 25 |
| 26 | 9.0 | 5.0 | 3.2 | 6.4 | 0.4 | 0.1 | W | 7.7 | 23 | 8 | 1020.2 | 84.5 | 6.8 | 0 | 0 | 0 | 0 | 0 | 0 | 26 |
| 27 | 14.4 | 6.4 | 4.0 | 6.3 | 4.5 | 0.0 | W | 7.2 | 25 | 7 | 1016.5 | 84.5 | 9.4 | 0 | 0 | 0 | 0 | 0 | 0 | 27 |
| 28 | 10.8 | 6.5 | 6.0 | 6.9 | 0.4 | 0.0 | NW | 2.6 | 16 | 7 | 1011.2 | 78.8 | 7.4 | 0 | 0 | 0 | 0 | 0 | 0 | 28 |
| Total/Mean | 6.9 | 1.8 | -0.5 | 3.9 | 65.6 | 64.9 | X | 3.8 | X | 6.5 | 1012.6 | 90.9 | 3.7 | 1 | 0 | 8 | 14 | 0 | 0 | Total/Mean |
| *Diff./% | -0.3 | 0.0 | 90% | 185% | *Diff./% | |||||||||||||||
| Date | Max. Temp. (°C) 09/09h | Min. Temp. (°C) 09/09h | Grass Min. Temp. (°C) 21/09h | Earth (30cms) Temp. (°C) 09h | Sun (Hours) 00/00h | R'fall (MM) 09/09h | Wind Dir'n 09h | Mean Wind Speed (MPH) 00/00h | Max. Gust Speed (MPH) 00/00h | Cloud Cover (Oktas) 09h | Mean MSL Air Pressure (mB) 00/00h | Mean Rel. Humd. (%) 00/00h | Mean Temp. (°C) 00/00h | Fog (vis. <1000m @ 09h) | Fog (vis. <200m @ 09h) | Snow or Rain and Snow 00/00h | Snow Lying @ 09h (>50% cover) | Hail 00/00h | Thunder 00/00h | Date |
Differences from average:
Differences from average shown in red. Reference periods used are as follows: Temperature 30 Years 1976/2005; rainfall 30 Years 1971/2000; sunshine 30 Years 1971/2000.
(*The differences from average quoted during the course of the month relate to the cumulative daily averages up to the date of the last observation, not the averages for the month as a whole)
Additional Data:
Rainfall Duration 50.5 hours
Air Frost Duration 122.2 hours
Graphs and Charts:
Click on the following links to view this month's graphs and charts.....
1. Daily Maximum, Minimum & Grass Minimum Temperatures
2. Daily Maximum & Minimum Temperatures (with 30 Year Comparative Means)
3. Daily Earth (30 cms Depth) Temperature @ 0900 GMT 4. Daily Rainfall 5. Daily Sunshine
6. Daily Maximum Gust & Mean Wind Speed 7. Daily Wind Direction @ 0900 GMT
8. Daily Mean MSL Air Pressure 9. Daily Mean Relative Humidity 10. Thermograph
11. Barograph 12. Hygrograph 13. Anemograph 14. Wind Direction
15. Sunshine Duration 16. Rainfall Intensity & Duration
February 2009 Weather Review:
......and click on the link below for a text report of the February 2009 weather in Royston
February (since 1973) at Royston (Iceni) Weather Station:
Mean day maximum temperature (30 years 1976/2005) 7.2°C
Mean night minimum temperature (30 years 1976/2005) 1.8°C
Highest temperature 18.5°C (13th February 1998); lowest temperature -10.5°C (12th & 13th February 1985)
Lowest grass minimum temperature -14.5°C (10th February 1986)
Warmest February 1990 (Mean temperature 8.1°C); coldest February 1986 (Mean temperature -1.6°C)
Average February rainfall (30 years 1971/2000) 35.0 mm
Wettest February 2001 (Rainfall 90.7 mm); driest February 1998 (Rainfall 4.8 mm)
Wettest Day 7th February 2001 (Rainfall 21.8 mm);
Highest number of "rain days" (0.2 mm or more) 21 (2000); lowest number of "rain days" 5 (1998)
Highest number of days with thunder 2 (1995)
Highest number of air frosts 24 (1986)
Highest number of ground frosts 25 (1986)
Highest number of days with snow falling 15 (1986)
Highest number of days with snow lying (ground with more than 50% snow cover @ 0900 GMT) 23 (1986)
|
|
|
|
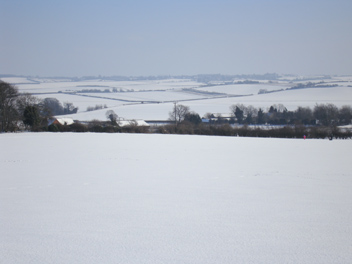
| The first half of February 2009 was cold and snowy in Royston, a sprinkling of snow on 1st being followed by a heavier fall in the morning of 2nd. This picture shows the Stevenson screen at Royston (Iceni) Weather Station at 0901 GMT on 2nd. A level snow cover of 8 cm has just been measured. The Stevenson screen houses the manually read dry and wet bulb, and the maximum and minimum, thermometers plus temperature and humidity sensors for both the cabled and wireless automatic weather stations. The protective sheath carrying the thermometer cable can be seen running down the left hand front leg of the screen stand and is joined underground by a cable from the automatic rain gauge (out of view). The wireless rain gauge and its transmitter (temporarily disabled by snow!) are partially visible on the right of the picture . | Therfield Heath, Royston is an ideal location for tobogganing with its hills and steeply sided dry valleys. This particular run as seen on 3rd February 2009 at 1155 GMT has been well worn after the snowfall on 2nd, but as this is school time relatively few people are on the slopes at present. The current snowy spell lasted until 15th February and was the most significant snowfall event in Royston since February 1991. The ground was covered with snow at the 0900 GMT observation on all days from 2nd to 15th inclusive, a maximum depth of 12 cm being achieved on 7th. This depth was somewhat diminished by intermittent melt on some days. A S wind of 6 knots gusting to 16 knots was blowing across the Heath at this time in a temperature of 1.3°C. The clear sky in evidence was a welcome change from the completely sunless previous day and sunshine for the day was 7.0 hours. | The snowfields of Royston! Expansive landscapes are visible from the higher ground just to the S of Royston and this one is viewed from a point not far from Flint Hall farm and Halfmoon Plantation and is looking SE across the Whiteley Hill area towards the village of Great Chishill on the horizon. This is barley growing country par excellence and many of the fledgling crops are being protected from the frequent night frosts by the snow cover. Although it is bright and sunny at the time of this photograph (1202 GMT on 7th February 2009) the commencement of the day's sunshine was delayed until 1020 GMT by low cloud and fog. The temperature is 1.3°C and the bright sunshine is melting much of the previous day's snowfall which is clinging to trees and bushes in spectacular fashion. A maximum temperature of 3.4°C was achieved after an overnight minimum of -4.2°C. |
Return to Welcome to Royston (Iceni) Weather Station page
(This page last updated 12th March 2009 2055 GMT)