Royston (Iceni) Weather Station
Daily Weather Observations - April 2008
(All Times GMT)
| Date | Max. Temp. (°C) 09/09h | Min. Temp. (°C) 09/09h | Grass Min. Temp. (°C) 21/09h | Earth (30cms) Temp. (°C) 09h | Sun (Hours) 00/00h | R'fall (MM) 09/09h | Wind Dir'n 09h | Mean Wind Speed (MPH) 00/00h | Max. Gust Speed (MPH) 00/00h | Cloud Cover (Oktas) 09h | Mean MSL Air Pressure (mB) 00/00h | Mean Rel. Humd. (%) 00/00h | Mean Temp. (°C) 00/00h | Fog (vis. <1000m @ 09h) | Fog (vis. <200m @ 09h) | Snow or Rain and Snow 00/00h | Snow Lying @ 09h (>50% cover) | Hail 00/00h | Thunder 00/00h | Date |
| 1 | 15.5 | 6.4 | 3.7 | 8.3 | 5.7 | 0.0 | W | 11.9 | 41 | 6 | 1014.9 | 72.1 | 10.5 | 0 | 0 | 0 | 0 | 0 | 0 | 1 |
| 2 | 14.1 | 7.0 | 3.5 | 8.5 | 2.9 | TR | NW | 8.0 | 25 | 5 | 1021.8 | 80.3 | 10.3 | 0 | 0 | 0 | 0 | 0 | 0 | 2 |
| 3 | 15.2 | 7.0 | 2.0 | 9.2 | 3.8 | 0.0 | N | 2.8 | 16 | 5 | 1027.3 | 87.2 | 10.9 | 0 | 0 | 0 | 0 | 0 | 0 | 3 |
| 4 | 17.1 | 8.1 | 2.7 | 9.6 | 4.3 | 0.4 | W | 3.7 | 21 | 8 | 1022.9 | 81.2 | 11.5 | 0 | 0 | 0 | 0 | 0 | 0 | 4 |
| 5 | 11.0 | 4.5 | 4.0 | 10.0 | 4.1 | 2.7 | N | 5.8 | 32 | 6 | 1012.0 | 83.5 | 6.1 | 0 | 0 | 0 | 0 | 0 | 0 | 5 |
| 6 | 7.1 | -0.5 | -2.0 | 9.4 | 4.5 | 0.6 | N | 3.9 | 18 | 8 | 1003.3 | 79.1 | 2.1 | 0 | 0 | 1 | 1 | 0 | 0 | 6 |
| 7 | 9.8 | 0.2 | -3.6 | 8.9 | 3.9 | TR | NW | 5.7 | 23 | 8 | 999.8 | 76.0 | 4.1 | 0 | 0 | 1 | 0 | 0 | 0 | 7 |
| 8 | 11.0 | -0.2 | -3.5 | 8.5 | 8.8 | 0.0 | SW | 3.6 | 21 | 1 | 1000.8 | 74.6 | 4.9 | 0 | 0 | 0 | 0 | 0 | 0 | 8 |
| 9 | 12.8 | 1.5 | -3.4 | 8.4 | 9.7 | 0.0 | W | 2.5 | 16 | 1 | 997.2 | 71.9 | 6.3 | 0 | 0 | 0 | 0 | 0 | 0 | 9 |
| 10 | 13.0 | 3.2 | -2.5 | 8.8 | 6.8 | 0.0 | SW | 3.7 | 21 | 0 | 995.4 | 69.4 | 7.5 | 0 | 0 | 0 | 0 | 0 | 0 | 10 |
| 11 | 11.5 | 2.0 | -1.1 | 8.7 | 7.9 | 2.4 | SW | 7.9 | 37 | 4 | 994.1 | 77.9 | 6.6 | 0 | 0 | 0 | 0 | 0 | 1 | 11 |
| 12 | 13.7 | 4.2 | 2.0 | 8.6 | 8.9 | 1.0 | SW | 8.9 | 35 | 1 | 1000.5 | 75.4 | 8.0 | 0 | 0 | 0 | 0 | 1 | 0 | 12 |
| 13 | 12.6 | 3.4 | 1.0 | 8.9 | 6.3 | 6.0 | SW | 4.2 | 23 | 2 | 1006.2 | 89.4 | 6.7 | 0 | 0 | 0 | 0 | 0 | 0 | 13 |
| 14 | 11.7 | 2.0 | -1.0 | 8.9 | 7.9 | 4.1 | NW | 3.2 | 23 | 1 | 1015.3 | 90.4 | 5.6 | 0 | 0 | 0 | 0 | 1 | 0 | 14 |
| 15 | 12.7 | -0.4 | -4.9 | 9.0 | 10.1 | 0.7 | W | 3.1 | 23 | 0 | 1021.0 | 78.8 | 5.7 | 0 | 0 | 0 | 0 | 0 | 0 | 15 |
| 16 | 10.5 | 1.8 | -2.5 | 9.4 | 3.8 | 0.0 | E | 1.5 | 16 | 3 | 1017.7 | 78.6 | 6.0 | 0 | 0 | 0 | 0 | 0 | 0 | 16 |
| 17 | 11.0 | 1.1 | -2.5 | 9.4 | 9.5 | 0.0 | NE | 4.3 | 28 | 7 | 1007.2 | 75.4 | 5.2 | 0 | 0 | 0 | 0 | 0 | 0 | 17 |
| 18 | 10.3 | 2.0 | -1.6 | 9.4 | 0.6 | 0.0 | NE | 7.0 | 32 | 8 | 997.4 | 84.0 | 7.0 | 0 | 0 | 0 | 0 | 0 | 0 | 18 |
| 19 | 8.2 | 6.0 | 4.6 | 9.4 | 0.0 | 2.9 | E | 5.4 | 23 | 8 | 997.5 | 88.9 | 6.8 | 0 | 0 | 0 | 0 | 0 | 0 | 19 |
| 20 | 12.5 | 6.3 | 5.9 | 9.2 | 0.4 | 3.3 | E | 3.4 | 18 | 8 | 1001.3 | 96.7 | 8.9 | 0 | 0 | 0 | 0 | 0 | 0 | 20 |
| 21 | 15.9 | 6.7 | 4.5 | 9.5 | 3.6 | 0.0 | NE | 5.0 | 25 | 6 | 1003.1 | 87.6 | 9.7 | 0 | 0 | 0 | 0 | 0 | 0 | 21 |
| 22 | 18.5 | 3.6 | 0.5 | 10.1 | 9.9 | 0.1 | NE | 1.8 | 16 | 7 | 1007.8 | 80.8 | 10.4 | 0 | 0 | 0 | 0 | 0 | 0 | 22 |
| 23 | 16.2 | 6.5 | 3.0 | 10.7 | 6.0 | 3.8 | W | 3.5 | 16 | 8 | 1013.4 | 83.2 | 10.9 | 0 | 0 | 0 | 0 | 0 | 0 | 23 |
| 24 | 13.6 | 6.0 | 4.6 | 10.7 | 5.0 | 5.7 | SW | 7.2 | 32 | 8 | 1017.4 | 86.7 | 9.6 | 0 | 0 | 0 | 0 | 1 | 0 | 24 |
| 25 | 16.5 | 7.8 | 6.2 | 10.6 | 4.0 | TR | W | 6.5 | 23 | 6 | 1023.7 | 78.3 | 12.0 | 0 | 0 | 0 | 0 | 0 | 0 | 25 |
| 26 | 21.8 | 8.6 | 6.8 | 11.3 | 11.2 | 0.0 | SW | 6.7 | 25 | 3 | 1020.3 | 70.0 | 15.1 | 0 | 0 | 0 | 0 | 0 | 0 | 26 |
| 27 | 18.4 | 12.0 | 9.4 | 12.1 | 4.0 | 1.5 | S | 7.4 | 35 | 6 | 1009.8 | 80.0 | 14.1 | 0 | 0 | 0 | 0 | 0 | 0 | 27 |
| 28 | 14.9 | 7.3 | 5.6 | 12.0 | 7.6 | 0.3 | SW | 7.2 | 28 | 4 | 1001.4 | 74.5 | 10.6 | 0 | 0 | 0 | 0 | 0 | 1 | 28 |
| 29 | 14.0 | 5.1 | 3.6 | 11.8 | 5.1 | 11.2 | S | 3.9 | 28 | 8 | 992.9 | 88.4 | 8.6 | 0 | 0 | 0 | 0 | 0 | 0 | 29 |
| 30 | 11.2 | 4.4 | 2.8 | 11.7 | 2.2 | 5.5 | E | 4.4 | 30 | 8 | 987.8 | 94.9 | 7.6 | 0 | 0 | 0 | 0 | 0 | 0 | 30 |
| Total/Mean | 13.4 | 4.5 | 1.6 | 9.7 | 168.4 | 52.2 | X | 5.1 | X | 5.1 | 1007.7 | 81.2 | 8.3 | 0 | 0 | 2 | 1 | 3 | 2 | Total/Mean |
| *Diff./% | +0.3 | 0.0 | 116% | 118% | *Diff./% | |||||||||||||||
| Date | Max. Temp. (°C) 09/09h | Min. Temp. (°C) 09/09h | Grass Min. Temp. (°C) 21/09h | Earth (30cms) Temp. (°C) 09h | Sun (Hours) 00/00h | R'fall (MM) 09/09h | Wind Dir'n 09h | Mean Wind Speed (MPH) 00/00h | Max. Gust Speed (MPH) 00/00h | Cloud Cover (Oktas) 09h | Mean MSL Air Pressure (mB) 00/00h | Mean Rel. Humd. (%) 00/00h | Mean Temp. (°C) 00/00h | Fog (vis. <1000m @ 09h) | Fog (vis. <200m @ 09h) | Snow or Rain and Snow 00/00h | Snow Lying @ 09h (>50% cover) | Hail 00/00h | Thunder 00/00h | Date |
Differences from average:
Differences from average shown in red. Reference periods used are as follows: Temperature 30 Years 1976/2005; rainfall 30 Years 1971/2000; sunshine 30 Years 1971/2000.
(*The differences from average quoted during the course of the month relate to the cumulative daily averages up to the date of the last observation, not the averages for the month as a whole)
Additional Data:
Rainfall Duration 40.1 hours
Air Frost Duration 5.3 hours
Graphs and Charts:
Click on the following links to view this month's graphs and charts.....
1. Daily Maximum, Minimum & Grass Minimum Temperatures
2. Daily Maximum & Minimum Temperatures (with 30 Year Comparative Means)
3. Daily Earth (30 cms Depth) Temperature @ 0900 GMT 4. Daily Rainfall 5. Daily Sunshine
6. Daily Maximum Gust & Mean Wind Speed 7. Daily Wind Direction @ 0900 GMT
8. Daily Mean MSL Air Pressure 9. Daily Mean Relative Humidity 10. Thermograph
11. Barograph 12. Hygrograph 13. Anemograph 14. Wind Direction
15. Sunshine Duration 16. Rainfall Intensity & Duration
April 2008 Weather Review:
......and click on the link below for a text report of the April 2008 weather in Royston
April (since 1973) at Royston (Iceni) Weather Station:
Mean daily maximum temperature (30 years 1976/2005) 13.1°C
Mean daily minimum temperature (30 years 1976/2005) 4.5°C
Highest temperature 25.5°C (16th April 2003); lowest temperature -4.1°C (11th April 1978)
Lowest grass minimum temperature -9.4°C (4th April 1996)
Warmest April 2007 (Mean temperature 12.3°C); coldest April 1978 (Mean temperature 6.2°C)
Average April rainfall (30 years 1971/2000) 44.3 mm
Wettest April 1998 (Rainfall 120.7 mm); driest April 2007 (Rainfall 1.6 mm)
Wettest Day 9th April 1998 (Rainfall 32.0 mm);
Highest number of "rain days" (0.2 mm or more) 26 (1998); lowest number of "rain days" 3 (2007)
Highest number of days with thunder 7 (1998)
Highest number of air frosts 8 (1975)
Highest number of ground frosts 15 (1974, 1984)
Highest number of days with snow falling 5 (1975, 1986)
Highest number of days with snow lying (ground with more than 50% snow cover @ 0900 GMT) 2 (1978, 1983)
|
|
|
|
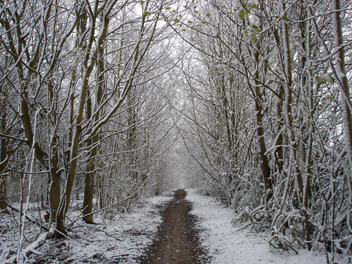
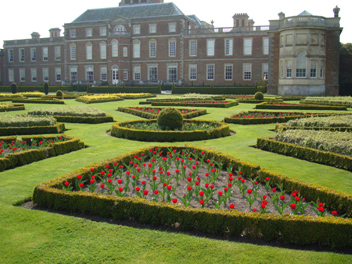
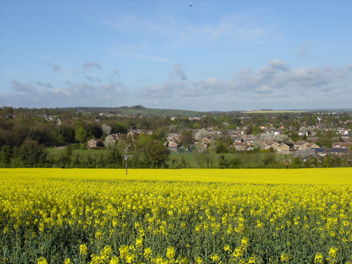
| On Sunday, 6th April 2008 the British Isles was covered by a northerly airstream situated between a low centred over southern Scandinavia and an anticyclone close to the west of Iceland. A series of troughs and shower clusters moved southwards in this brisk flow from the north and one of these has given Royston a surprise snowfall, as seen here on the Icknield Way 1.5 km to the east of the town at 0742 GMT. Tree branches and hedgerows were liberally covered with snow with conifers particularly weighed down. A journey northwards over the South Cambridgeshire Plain revealed Royston to be the northern limit of the snowfall, no doubt due to the increased altitude. The temperature at the time of this photograph was -0.3°C, later rising to a maximum of 7.1°C (dispersing the snow). | This is the less photographed N side of Wimpole Hall (10 km N of Royston), the largest and grandest Georgian mansion in Cambridgeshire. The Hall is set in the premier working estate in the county, which features a fine wooded park, Gothic Tower, Chinese Bridge, two serpentine lakes, and the working Home Farm housing the largest rare breeds centre in East Anglia. This view at 1027 GMT on 22nd April 2008 shows a section of the magnificent formal parterre garden which is situated between the Hall and the farm/parkland areas. As can be seen the tulips in the parterre are just coming into bloom, but many are still in bud only. The lambing season on the farm has just ended and the lambs have left the covered areas on the farm for the fields behind the photographer. The day was essentially sunny (9.9 hours sunshine at Royston). | The distinctive colour of oilseed rape is once again in evidence around Royston in Spring 2008, although perhaps not in such abundance as in some previous recent years. The Hyde Hill area to the east of the town is, however, particularly well endowed with the crop this year, and this view (at 0753 GMT on 28th April 2008) is looking westwards across Royston from Hyde Hill. Therfield Heath is visible in the left background whilst a patch of oilseed rape can be just detected around Odsey on the far horizon. Although the early morning sunshine over the region gave way to showers later in the day, Royston itself largely escaped these, but in mid-afternoon a thunderstorm passed just to the SE of the town and two loud peals of thunder were heard. Despite the cloudier periods sunshine for the day was 7.6 hours. |
Return to Welcome to Royston (Iceni) Weather Station page
(This page last updated 12th May 2008 1930 GMT)