
Royston (Iceni) Weather Station
Daily Weather Observations - March 2008
(All Times GMT)
| Date | Max. Temp. (°C) 09/09h | Min. Temp. (°C) 09/09h | Grass Min. Temp. (°C) 21/09h | Earth (30cms) Temp. (°C) 09h | Sun (Hours) 00/00h | R'fall (MM) 09/09h | Wind Dir'n 09h | Mean Wind Speed (MPH) 00/00h | Max. Gust Speed (MPH) 00/00h | Cloud Cover (Oktas) 09h | Mean MSL Air Pressure (mB) 00/00h | Mean Rel. Humd. (%) 00/00h | Mean Temp. (°C) 00/00h | Fog (vis. <1000m @ 09h) | Fog (vis. <200m @ 09h) | Snow or Rain and Snow 00/00h | Snow Lying @ 09h (>50% cover) | Hail 00/00h | Thunder 00/00h | Date |
| 1 | 12.3 | 6.5 | 3.5 | 6.4 | 7.4 | 0.0 | W | 16.0 | 62 | 0 | 1002.8 | 72.2 | 9.3 | 0 | 0 | 0 | 0 | 0 | 0 | 1 |
| 2 | 11.9 | 8.7 | 5.9 | 6.8 | 5.6 | 0.0 | W | 10.9 | 41 | 1 | 1006.0 | 71.4 | 9.4 | 0 | 0 | 0 | 0 | 0 | 0 | 2 |
| 3 | 8.6 | 2.4 | -0.9 | 6.8 | 8.3 | 0.1 | W | 9.2 | 39 | 0 | 1007.5 | 74.4 | 4.5 | 0 | 0 | 0 | 0 | 0 | 0 | 3 |
| 4 | 8.7 | -1.4 | -6.9 | 6.2 | 3.4 | 0.5 | NW | 4.6 | 30 | 8 | 1023.0 | 83.4 | 2.3 | 0 | 0 | 1 | 0 | 0 | 0 | 4 |
| 5 | 9.5 | -2.5 | -7.8 | 5.7 | 9.0 | 0.0 | W | 5.6 | 28 | 1 | 1030.6 | 78.8 | 3.7 | 0 | 0 | 0 | 0 | 0 | 0 | 5 |
| 6 | 13.5 | 6.6 | 4.9 | 5.8 | 3.2 | 1.1 | W | 8.5 | 28 | 7 | 1019.9 | 76.3 | 9.0 | 0 | 0 | 0 | 0 | 0 | 0 | 6 |
| 7 | 11.1 | 5.5 | 5.0 | 6.5 | 7.0 | 0.0 | W | 9.7 | 41 | 6 | 1008.6 | 72.4 | 7.9 | 0 | 0 | 0 | 0 | 0 | 0 | 7 |
| 8 | 11.7 | 3.5 | 1.4 | 6.8 | 1.0 | 3.0 | SW | 10.7 | 39 | 7 | 1000.8 | 89.7 | 7.6 | 0 | 0 | 0 | 0 | 0 | 0 | 8 |
| 9 | 9.8 | 4.6 | 2.4 | 7.0 | 3.9 | 8.6 | SW | 6.2 | 23 | 7 | 992.5 | 87.8 | 6.3 | 0 | 0 | 0 | 0 | 0 | 0 | 9 |
| 10 | 8.9 | 2.5 | 0.1 | 6.9 | 1.3 | 7.3 | S | 14.4 | 58 | 8 | 967.5 | 91.9 | 5.8 | 0 | 0 | 0 | 0 | 0 | 0 | 10 |
| 11 | 13.0 | 4.5 | 2.0 | 6.9 | 5.8 | 0.5 | SW | 14.8 | 62 | 6 | 981.6 | 79.5 | 8.1 | 0 | 0 | 0 | 0 | 0 | 0 | 11 |
| 12 | 10.8 | 4.0 | 1.6 | 7.0 | 6.1 | 0.0 | W | 17.8 | 60 | 7 | 995.9 | 67.2 | 7.1 | 0 | 0 | 0 | 0 | 0 | 0 | 12 |
| 13 | 10.6 | 3.9 | 0.6 | 6.9 | 2.6 | 2.2 | SW | 6.8 | 28 | 6 | 1007.9 | 85.2 | 6.9 | 0 | 0 | 0 | 0 | 0 | 0 | 13 |
| 14 | 13.1 | 5.1 | 2.4 | 7.0 | 6.4 | TR | NW | 4.4 | 16 | 7 | 1008.5 | 83.4 | 8.5 | 0 | 0 | 0 | 0 | 0 | 0 | 14 |
| 15 | 13.3 | 8.6 | 7.4 | 7.7 | 0.1 | 22.0 | SE | 3.5 | 21 | 8 | 1001.7 | 94.5 | 10.1 | 0 | 0 | 0 | 0 | 0 | 0 | 15 |
| 16 | 7.1 | 6.7 | 6.5 | 8.4 | 0.0 | 2.1 | NE | 9.6 | 39 | 8 | 999.5 | 94.6 | 6.4 | 0 | 0 | 0 | 0 | 0 | 0 | 16 |
| 17 | 9.3 | 3.5 | 1.6 | 7.9 | 1.2 | 0.1 | N | 3.3 | 25 | 7 | 1016.1 | 84.5 | 4.4 | 0 | 0 | 0 | 0 | 1 | 0 | 17 |
| 18 | 6.9 | 0.1 | -4.1 | 7.8 | 0.1 | 0.0 | N | 3.4 | 18 | 8 | 1018.4 | 81.2 | 3.5 | 0 | 0 | 0 | 0 | 0 | 0 | 18 |
| 19 | 8.7 | 0.5 | -3.0 | 7.5 | 3.8 | 0.3 | N | 5.0 | 25 | 6 | 1020.4 | 81.0 | 3.9 | 0 | 0 | 0 | 0 | 0 | 0 | 19 |
| 20 | 9.6 | 1.6 | -2.2 | 7.3 | 0.2 | 5.1 | W | 10.7 | 41 | 8 | 1008.6 | 90.7 | 5.5 | 0 | 0 | 0 | 0 | 0 | 0 | 20 |
| 21 | 9.5 | 3.4 | 0.5 | 7.3 | 4.6 | 5.4 | NW | 14.9 | 51 | 6 | 986.2 | 75.2 | 5.3 | 0 | 0 | 0 | 0 | 0 | 0 | 21 |
| 22 | 5.2 | 0.3 | -0.1 | 7.3 | 1.9 | 4.9 | N | 9.7 | 44 | 8 | 997.1 | 94.0 | 1.4 | 0 | 0 | 1 | 0 | 1 | 0 | 22 |
| 23 | 3.4 | -1.6 | -6.6 | 6.6 | 0.7 | 2.0 | S | 5.1 | 23 | 8 | 997.7 | 95.1 | 0.3 | 0 | 0 | 1 | 1 | 0 | 0 | 23 |
| 24 | 6.4 | -1.4 | -4.4 | 5.9 | 2.6 | 0.1 | W | 5.1 | 25 | 8 | 998.0 | 81.6 | 1.5 | 0 | 0 | 1 | 0 | 0 | 0 | 24 |
| 25 | 6.6 | -2.3 | -6.3 | 5.9 | 6.4 | 0.2 | NW | 6.1 | 32 | 5 | 1003.8 | 71.2 | 2.7 | 0 | 0 | 0 | 0 | 0 | 0 | 25 |
| 26 | 9.8 | 3.8 | 3.0 | 6.0 | 0.8 | 4.3 | SE | 1.5 | 16 | 8 | 996.7 | 93.0 | 5.9 | 0 | 0 | 0 | 0 | 0 | 0 | 26 |
| 27 | 11.8 | 3.5 | 1.6 | 6.7 | 6.0 | 2.4 | NW | 2.4 | 18 | 5 | 998.4 | 83.8 | 6.3 | 0 | 0 | 0 | 0 | 1 | 0 | 27 |
| 28 | 10.7 | 3.6 | 1.3 | 7.1 | 0.2 | 5.0 | S | 10.8 | 41 | 8 | 995.3 | 89.7 | 6.4 | 0 | 0 | 0 | 0 | 0 | 0 | 28 |
| 29 | 11.7 | 3.7 | 1.3 | 7.1 | 4.6 | 1.0 | SW | 12.5 | 48 | 1 | 1002.8 | 83.3 | 7.8 | 0 | 0 | 0 | 0 | 0 | 0 | 29 |
| 30 | 14.7 | 7.0 | 5.5 | 7.5 | 10.5 | 0.0 | W | 6.1 | 39 | 3 | 997.5 | 72.2 | 9.7 | 0 | 0 | 0 | 0 | 0 | 0 | 30 |
| 31 | 13.9 | 3.8 | -0.7 | 8.0 | 3.2 | 0.0 | S | 4.3 | 23 | 8 | 1011.2 | 87.3 | 7.8 | 1 | 0 | 0 | 0 | 0 | 0 | 31 |
| Total/Mean | 10.1 | 3.2 | 0.5 | 6.9 | 117.5 | 78.2 | X | 8.2 | X | 5.9 | 1003.3 | 82.8 | 6.0 | 1 | 0 | 4 | 1 | 3 | 0 | Total/Mean |
| *Diff./% | -0.3 | -0.3 | 110% | 184% | *Diff./% | |||||||||||||||
| Date | Max. Temp. (°C) 09/09h | Min. Temp. (°C) 09/09h | Grass Min. Temp. (°C) 21/09h | Earth (30cms) Temp. (°C) 09h | Sun (Hours) 00/00h | R'fall (MM) 09/09h | Wind Dir'n 09h | Mean Wind Speed (MPH) 00/00h | Max. Gust Speed (MPH) 00/00h | Cloud Cover (Oktas) 09h | Mean MSL Air Pressure (mB) 00/00h | Mean Rel. Humd. (%) 00/00h | Mean Temp. (°C) 00/00h | Fog (vis. <1000m @ 09h) | Fog (vis. <200m @ 09h) | Snow or Rain and Snow 00/00h | Snow Lying @ 09h (>50% cover) | Hail 00/00h | Thunder 00/00h | Date |
Differences from average:
Differences from average shown in red. Reference periods used are as follows: Temperature 30 Years 1976/2005; rainfall 30 Years 1971/2000; sunshine 30 Years 1971/2000.
(*The differences from average quoted during the course of the month relate to the cumulative daily averages up to the date of the last observation, not the averages for the month as a whole)
Additional Data:
Rainfall Duration 69.3 hours
Air Frost Duration 49.8 hours
Graphs and Charts:
Click on the following links to view this month's graphs and charts.....
1. Daily Maximum, Minimum & Grass Minimum Temperatures
2. Daily Maximum & Minimum Temperatures (with 30 Year Comparative Means)
3. Daily Earth (30 cms Depth) Temperature @ 0900 GMT 4. Daily Rainfall 5. Daily Sunshine
6. Daily Maximum Gust & Mean Wind Speed 7. Daily Wind Direction @ 0900 GMT
8. Daily Mean MSL Air Pressure 9. Daily Mean Relative Humidity 10. Thermograph
11. Barograph 12. Hygrograph 13. Anemograph 14. Wind Direction
15. Sunshine Duration 16. Rainfall Intensity & Duration
March 2008 Weather Review:
......and click on the link below for a text report of the March 2008 weather in Royston
March (since 1973) at Royston (Iceni) Weather Station:
Mean day maximum temperature (30 years 1976/2005) 10.4°C
Mean night minimum temperature (30 years 1976/2005) 3.5°C
Highest temperature 21.6°C (17th March 1990); lowest temperature -6.6°C (3rd March 1986)
Lowest grass minimum temperature -13.7°C (3rd March 1986)
Warmest March 1997 (Mean temperature 9.1°C); coldest March 1987 (Mean temperature 4.3°C)
Average March rainfall (30 years 1971/2000) 42.5 mm
Wettest March 1979 (Rainfall 97.8 mm); driest March 1997 (Rainfall 8.1 mm)
Wettest Day 2nd March 1995 (Rainfall 30.1 mm);
Highest number of "rain days" (0.2 mm or more) 25 (1981); lowest number of "rain days" 3 (2003)
Highest number of days with thunder 2 (1986, 1995)
Highest number of air frosts 15 (1987)
Highest number of ground frosts 21 (1987)
Highest number of days with snow falling 11 (1979)
Highest number of days with snow lying (ground with more than 50% snow cover @ 0900 GMT) 4 (1986)
|
|
|
|
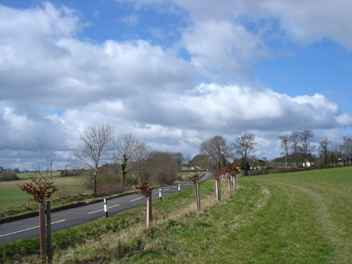
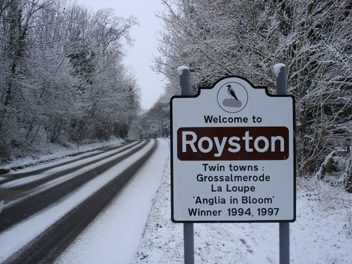
| This circumzenithal arc was seen over Royston in the afternoon of 2nd March 2008 (photograph taken at 1500 GMT). This optical phenomenon arises from refraction of sunlight through ice crystals in certain types of cloud. The morning had been fairly sunny but cloud built up in the afternoon to allow only fleeting glimpses of bright sunshine, but fortunately insufficient to block this view of the arc. The cloud type that afternoon seemingly favoured the appearance of optical phenomena since a bright mock sun was viewed at a similar time over the adjacent county of Cambridgeshire. Sunshine for the day was 5.6 hours and the maximum temperature 11.9°C after an overnight minimum of 8.7°C. (Photo: Rob Clack, Royston). | The weather in this picture (Good Friday, 21st March 2008 at 0942 GMT) showing the B1039 Saffron Walden to Royston road as it approaches Eagle Tavern 1.5 km to the SE of Royston may look benign but it does, in fact, herald a cold and frosty spell for the Easter period. A low pressure system which had moved eastwards to the N of the British Isles on 20th to become centred over southern Scandinavia on 21st introduced a cold northerly airstream across the country, with the air being sourced from high latitudes. At the time of this photograph a NW wind of mean speed 13 knots gusting to 28 knots was in evidence, but by 1055 GMT gust speeds had increased to 40 knots. The day's sunshine amounted to 4.6 hours. | It is perhaps ironic that the first snowfall of the 'winter' season in Royston occurred as late as just after the Spring equinox! This was the scene in Newmarket Road, Royston on Easter Day, 23rd March 2008 (at 0948 GMT) as a small polar low drifted southwards in the northerly airstream. The winds became light and variable as the centre of this low tracked close to Royston to reach the Thames estuary by early afternoon. A 3 cm level depth of snow was measured at 0900 GMT but with a maximum temperature of 3.4°C occurring later in the day a lot of the snow, particularly on the tree branches, soon thawed. The 'Welcome to Royston' sign seen here is one of two new signs erected at this location only a few days previously. |
Return to Welcome to Royston (Iceni) Weather Station page
(This page last updated 11th April 2008 2003 GMT)