Royston (Iceni) Weather Station
Daily Weather Observations - February 2008
(All Times GMT)
| Date | Max. Temp. (°C) 09/09h | Min. Temp. (°C) 09/09h | Grass Min. Temp. (°C) 21/09h | Earth (30cms) Temp. (°C) 09h | Sun (Hours) 00/00h | R'fall (MM) 09/09h | Wind Dir'n 09h | Mean Wind Speed (MPH) 00/00h | Max. Gust Speed (MPH) 00/00h | Cloud Cover (Oktas) 09h | Mean MSL Air Pressure (mB) 00/00h | Mean Rel. Humd. (%) 00/00h | Mean Temp. (°C) 00/00h | Fog (vis. <1000m @ 09h) | Fog (vis. <200m @ 09h) | Snow or Rain and Snow 00/00h | Snow Lying @ 09h (>50% cover) | Hail 00/00h | Thunder 00/00h | Date |
| 1 | 7.0 | 2.8 | 0.9 | 6.0 | 7.6 | 0.0 | W | 13.4 | 41 | 4 | 995.6 | 75.0 | 3.6 | 0 | 0 | 0 | 0 | 0 | 0 | 1 |
| 2 | 5.9 | -0.7 | -4.0 | 5.4 | 4.3 | 0.0 | SW | 8.2 | 32 | 0 | 1009.8 | 77.3 | 2.6 | 0 | 0 | 0 | 0 | 0 | 0 | 2 |
| 3 | 6.8 | 4.1 | 2.6 | 5.0 | 2.8 | 2.7 | S | 10.3 | 46 | 6 | 997.8 | 78.1 | 5.2 | 0 | 0 | 0 | 0 | 0 | 0 | 3 |
| 4 | 10.0 | 2.4 | 0.5 | 5.3 | 6.3 | 3.7 | SW | 7.8 | 30 | 0 | 994.8 | 88.6 | 5.6 | 0 | 0 | 0 | 0 | 0 | 0 | 4 |
| 5 | 12.5 | 5.5 | 3.5 | 5.4 | 4.9 | 0.4 | SW | 12.7 | 46 | 5 | 994.9 | 89.7 | 9.3 | 0 | 0 | 0 | 0 | 0 | 0 | 5 |
| 6 | 9.5 | 5.7 | 3.0 | 6.0 | 7.9 | TR | NW | 8.1 | 32 | 4 | 1019.0 | 79.2 | 6.7 | 0 | 0 | 0 | 0 | 0 | 0 | 6 |
| 7 | 11.6 | 3.4 | 0.7 | 5.6 | 1.8 | 0.0 | S | 6.8 | 32 | 7 | 1031.1 | 87.1 | 7.5 | 0 | 0 | 0 | 0 | 0 | 0 | 7 |
| 8 | 11.9 | 3.6 | 0.5 | 6.0 | 8.8 | 0.0 | S | 5.4 | 25 | 0 | 1028.6 | 86.2 | 6.8 | 0 | 0 | 0 | 0 | 0 | 0 | 8 |
| 9 | 13.2 | 4.1 | -0.4 | 5.7 | 8.9 | 0.0 | S | 6.4 | 25 | 1 | 1028.5 | 74.9 | 7.8 | 0 | 0 | 0 | 0 | 0 | 0 | 9 |
| 10 | 13.9 | 1.8 | -4.1 | 5.4 | 8.8 | 0.0 | SW | 1.2 | 16 | 0 | 1031.8 | 67.5 | 6.6 | 0 | 0 | 0 | 0 | 0 | 0 | 10 |
| 11 | 12.0 | 0.3 | -5.0 | 4.9 | 9.0 | 0.0 | SE | 2.9 | 16 | 0 | 1031.9 | 85.6 | 5.9 | 0 | 0 | 0 | 0 | 0 | 0 | 11 |
| 12 | 12.8 | 0.9 | -4.1 | 4.5 | 9.0 | 0.0 | CALM | 0.6 | 12 | 0 | 1033.5 | 91.4 | 5.9 | 0 | 0 | 0 | 0 | 0 | 0 | 12 |
| 13 | 4.9 | -2.5 | -6.8 | 4.4 | 4.5 | 0.2 | S | 0.6 | 12 | 0 | 1035.4 | 98.8 | 1.3 | 0 | 0 | 0 | 0 | 0 | 0 | 13 |
| 14 | 4.5 | 2.0 | 1.8 | 4.4 | 0.0 | TR | NE | 2.3 | 14 | 8 | 1036.9 | 97.0 | 3.0 | 0 | 0 | 0 | 0 | 0 | 0 | 14 |
| 15 | 6.5 | 2.7 | 2.2 | 4.7 | 3.4 | 0.0 | NE | 2.4 | 21 | 8 | 1037.5 | 84.7 | 2.9 | 0 | 0 | 0 | 0 | 0 | 0 | 15 |
| 16 | 6.0 | -4.4 | -10.0 | 4.5 | 9.3 | 0.0 | E | 1.0 | 18 | 0 | 1040.7 | 84.6 | -0.6 | 0 | 0 | 0 | 0 | 0 | 0 | 16 |
| 17 | 9.0 | -5.5 | -11.3 | 3.6 | 9.4 | 0.0 | CALM | 0.5 | 12 | 0 | 1037.5 | 82.5 | 0.2 | 0 | 0 | 0 | 0 | 0 | 0 | 17 |
| 18 | 9.5 | -3.7 | -9.9 | 3.0 | 9.4 | 0.0 | CALM | 0.2 | 9 | 0 | 1031.8 | 88.9 | 1.1 | 0 | 0 | 0 | 0 | 0 | 0 | 18 |
| 19 | 3.9 | -2.5 | -8.0 | 2.8 | 0.4 | 0.0 | E | 0.3 | 9 | 8 | 1023.6 | 99.1 | -0.2 | 1 | 1 | 0 | 0 | 0 | 0 | 19 |
| 20 | 8.0 | -1.6 | -6.7 | 2.7 | 0.8 | 0.0 | SW | 2.5 | 18 | 8 | 1017.8 | 95.3 | 2.0 | 1 | 0 | 0 | 0 | 0 | 0 | 20 |
| 21 | 10.5 | 3.2 | 1.3 | 3.0 | 0.1 | TR | SW | 10.8 | 3.7 | 8 | 1017.9 | 90.9 | 7.7 | 0 | 0 | 0 | 0 | 0 | 0 | 21 |
| 22 | 12.0 | 9.5 | 8.0 | 4.3 | 0.0 | 0.0 | SW | 13.6 | 44 | 8 | 1018.9 | 89.2 | 10.2 | 0 | 0 | 0 | 0 | 0 | 0 | 22 |
| 23 | 12.0 | 5.7 | 2.9 | 5.1 | 0.3 | 0.0 | W | 8.1 | 32 | 8 | 1021.6 | 89.2 | 8.9 | 0 | 0 | 0 | 0 | 0 | 0 | 23 |
| 24 | 13.0 | 7.9 | 5.3 | 5.7 | 2.0 | 1.8 | SW | 6.7 | 30 | 3 | 1014.8 | 86.7 | 9.0 | 0 | 0 | 0 | 0 | 0 | 0 | 24 |
| 25 | 11.0 | 1.5 | -2.0 | 6.0 | 5.6 | 2.0 | S | 7.2 | 37 | 1 | 1014.5 | 87.3 | 6.2 | 0 | 0 | 0 | 0 | 0 | 0 | 25 |
| 26 | 12.4 | 9.1 | 7.0 | 6.0 | 9.3 | 0.0 | W | 13.1 | 44 | 0 | 1002.6 | 78.0 | 9.3 | 0 | 0 | 0 | 0 | 0 | 0 | 26 |
| 27 | 12.0 | 4.1 | 1.1 | 6.2 | 8.6 | 0.0 | W | 6.4 | 28 | 7 | 1014.5 | 76.5 | 7.0 | 0 | 0 | 0 | 0 | 0 | 0 | 27 |
| 28 | 11.5 | 2.4 | -3.3 | 6.0 | 1.8 | 0.0 | E | 1.3 | 14 | 6 | 1017.3 | 76.5 | 6.7 | 0 | 0 | 0 | 0 | 0 | 0 | 28 |
| 29 | 11.6 | 3.5 | -0.3 | 6.1 | 0.2 | 2.1 | SW | 12.0 | 58 | 8 | 1007.4 | 87.7 | 7.1 | 0 | 0 | 0 | 0 | 0 | 0 | 29 |
| Total/Mean | 9.8 | 2.3 | -1.2 | 5.0 | 145.0 | 12.9 | X | 6.0 | X | 3.7 | 1020.3 | 85.3 | 5.4 | 2 | 1 | 0 | 0 | 0 | 0 | Total/Mean |
| *Diff./% | +2.6 | +0.5 | 200% | 37% | *Diff./% | |||||||||||||||
| Date | Max. Temp. (°C) 09/09h | Min. Temp. (°C) 09/09h | Grass Min. Temp. (°C) 21/09h | Earth (30cms) Temp. (°C) 09h | Sun (Hours) 00/00h | R'fall (MM) 09/09h | Wind Dir'n 09h | Mean Wind Speed (MPH) 00/00h | Max. Gust Speed (MPH) 00/00h | Cloud Cover (Oktas) 09h | Mean MSL Air Pressure (mB) 00/00h | Mean Rel. Humd. (%) 00/00h | Mean Temp. (°C) 00/00h | Fog (vis. <1000m @ 09h) | Fog (vis. <200m @ 09h) | Snow or Rain and Snow 00/00h | Snow Lying @ 09h (>50% cover) | Hail 00/00h | Thunder 00/00h | Date |
Differences from average:
Differences from average shown in red. Reference periods used are as follows: Temperature 30 Years 1976/2005; rainfall 30 Years 1971/2000; sunshine 30 Years 1971/2000.
(*The differences from average quoted during the course of the month relate to the cumulative daily averages up to the date of the last observation, not the averages for the month as a whole)
Additional Data:
Rainfall Duration 20.1 hours
Air Frost Duration 69.9 hours
Graphs and Charts:
Click on the following links to view this month's graphs and charts.....
1. Daily Maximum, Minimum & Grass Minimum Temperatures
2. Daily Maximum & Minimum Temperatures (with 30 Year Comparative Means)
3. Daily Earth (30 cms Depth) Temperature @ 0900 GMT 4. Daily Rainfall 5. Daily Sunshine
6. Daily Maximum Gust & Mean Wind Speed 7. Daily Wind Direction @ 0900 GMT
8. Daily Mean MSL Air Pressure 9. Daily Mean Relative Humidity 10. Thermograph
11. Barograph 12. Hygrograph 13. Anemograph 14. Wind Direction
15. Sunshine Duration 16. Rainfall Intensity & Duration
February 2008 Weather Review:
......and click on the link below for a text report of the February 2008 weather in Royston
February (since 1973) at Royston (Iceni) Weather Station:
Mean day maximum temperature (30 years 1976/2005) 7.2°C
Mean night minimum temperature (30 years 1976/2005) 1.8°C
Highest temperature 18.5°C (13th February 1998); lowest temperature -10.5°C (12th & 13th February 1985)
Lowest grass minimum temperature -14.5°C (10th February 1986)
Warmest February 1990 (Mean temperature 8.1°C); coldest February 1986 (Mean temperature -1.6°C)
Average February rainfall (30 years 1971/2000) 35.0 mm
Wettest February 2001 (Rainfall 90.7 mm); driest February 1998 (Rainfall 4.8 mm)
Wettest Day 7th February 2001 (Rainfall 21.8 mm);
Highest number of "rain days" (0.2 mm or more) 21 (2000); lowest number of "rain days" 5 (1998)
Highest number of days with thunder 2 (1995)
Highest number of air frosts 24 (1986)
Highest number of ground frosts 25 (1986)
Highest number of days with snow falling 15 (1986)
Highest number of days with snow lying (ground with more than 50% snow cover @ 0900 GMT) 23 (1986)
|
|
|
|
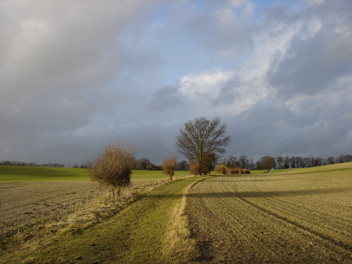
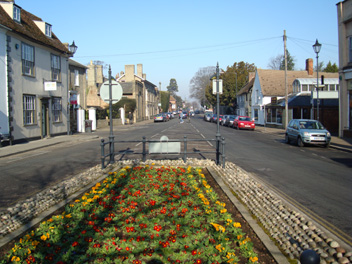
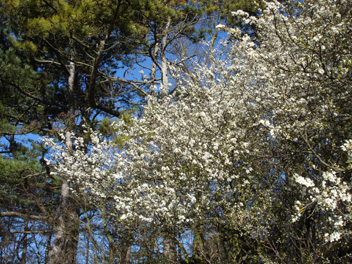
| Late afternoon sunshine is illuminating the scene on the Hertfordshire Way about 1.5 km south of the town of Royston on 5th February 2008 (at 1546 GMT). This view is looking northwards along the bridleway which ascends to the ridge in the background, from where it is downhill for most of the way to the town centre. Just out of the picture to the right is Halfmoon Plantation, whilst the east-west Lovers Walk runs just to the rear. The Hertfordshire Way continues southwards from this point to ascend the northern escarpment of the East Anglian Heights at about 1.5 km distance. A blustery SSW wind of mean speed 14 knots gusting to 28 knots is being experienced in a temperature of 11.8°C at this time. | This view from Lower King Street, Royston is looking northwards towards Kneesworth Street into which it runs a few metres further along the road. This garden (and a similar one just behind it) is on an island along with several buildings between the two sides of the road. The sign at the end of the garden proclaims this to be the start of the town centre, the location being just a short distance from the Cross where the ancient Ermine Street and Icknield Way meet. This photograph was taken at 1051 GMT on 18th February 2008 and the temperature is only 1.7°C after an overnight minimum of -3.7°C. Several km to the north at this time thick fog patches are in evidence on the South Cambridgeshire Plain, although Royston is clear. | It might still be Winter (26th February 2008) but this has not deterred this blossom in Cow Plantation on the Burloes estate on the SE outskirts of Royston from making an early appearance this year. This is undoubtedly due to the very mild Winter conditions which have been experienced in the eastern region this year. The January mean temperature was 3°C above normal after a marginally milder than average December, whilst February to date has been almost 1.5°C above normal. A consequence of this mildness is that the Winter has been virtually snow free, the only snow being observed being a few fine flakes on 3rd January. February has also been remarkably sunny (e.g. 9.3 hours sunshine on the day of this picture). |
Return to Welcome to Royston (Iceni) Weather Station page
(This page last updated 11th March 2008 2037 GMT)