Royston (Iceni) Weather Station
Daily Weather Observations - May 2007
(All Times GMT)
| Date | Max. Temp. (°C) 09/09h | Min. Temp. (°C) 09/09h | Grass Min. Temp. (°C) 21/09h | Earth (30cms) Temp. (°C) 09h | Sun (Hours) 00/00h | R'fall (MM) 09/09h | Wind Dir'n 09h | Mean Wind Speed (MPH) 00/00h | Max. Gust Speed (MPH) 00/00h | Cloud Cover (Oktas) 09h | Mean MSL Air Pressure (mB) 00/00h | Mean Rel. Humd. (%) 00/00h | Mean Temp. (°C) 00/00h | Fog (vis. <1000m @ 09h) | Fog (vis. <200m @ 09h) | Snow or Rain and Snow 00/00h | Snow Lying @ 09h (>50% cover) | Hail 00/00h | Thunder 00/00h | Date |
| 1 | 21.1 | 4.2 | 0.8 | 13.7 | 13.9 | 0.0 | E | 0.9 | 28 | 0 | 1013.4 | 67.4 | 12.8 | 0 | 0 | 0 | 0 | 0 | 0 | 1 |
| 2 | 22.2 | 4.0 | 0.9 | 13.8 | 14.0 | 0.0 | NE | 2.4 | 25 | 0 | 1014.7 | 74.8 | 12.4 | 0 | 0 | 0 | 0 | 0 | 0 | 2 |
| 3 | 12.9 | 7.2 | 4.5 | 14.1 | 0.1 | 0.0 | NE | 1.6 | 18 | 8 | 1016.3 | 85.4 | 9.3 | 0 | 0 | 0 | 0 | 0 | 0 | 3 |
| 4 | 17.3 | 7.8 | 7.5 | 13.7 | 3.0 | 0.0 | N | 1.9 | 21 | 7 | 1015.5 | 80.8 | 10.6 | 0 | 0 | 0 | 0 | 0 | 0 | 4 |
| 5 | 13.9 | 8.0 | 7.6 | 14.0 | 2.9 | 0.0 | N | 0.1 | 14 | 8 | 1017.9 | 81.3 | 9.5 | 0 | 0 | 0 | 0 | 0 | 0 | 5 |
| 6 | 19.8 | 7.8 | 3.5 | 13.4 | 1.6 | 7.0 | SW | 6.2 | 35 | 7 | 1013.2 | 71.9 | 13.3 | 0 | 0 | 0 | 0 | 0 | 0 | 6 |
| 7 | 16.9 | 10.6 | 9.8 | 13.9 | 3.1 | 6.9 | CALM | 3.1 | 25 | 8 | 1006.4 | 91.1 | 12.5 | 0 | 0 | 0 | 0 | 0 | 0 | 7 |
| 8 | 17.8 | 9.2 | 7.5 | 13.9 | 2.7 | 0.1 | SW | 7.7 | 39 | 7 | 1007.5 | 76.5 | 12.9 | 0 | 0 | 0 | 0 | 0 | 0 | 8 |
| 9 | 16.2 | 9.2 | 7.6 | 14.1 | 1.8 | 7.3 | W | 3.7 | 30 | 7 | 1008.5 | 85.6 | 12.6 | 0 | 0 | 0 | 0 | 0 | 0 | 9 |
| 10 | 16.8 | 9.3 | 7.6 | 14.4 | 3.4 | 19.1 | SW | 6.8 | 46 | 7 | 1001.1 | 87.4 | 12.0 | 0 | 0 | 0 | 0 | 0 | 0 | 10 |
| 11 | 17.2 | 7.4 | 6.6 | 14.1 | 4.2 | 4.1 | W | 4.2 | 28 | 5 | 998.6 | 88.5 | 11.1 | 0 | 0 | 0 | 0 | 0 | 0 | 11 |
| 12 | 16.5 | 9.5 | 8.0 | 14.1 | 5.4 | 1.0 | SW | 5.6 | 35 | 6 | 1000.3 | 85.9 | 12.5 | 0 | 0 | 0 | 0 | 0 | 0 | 12 |
| 13 | 13.7 | 9.2 | 8.0 | 14.0 | 1.0 | 6.4 | E | 1.3 | 23 | 8 | 997.7 | 95.4 | 11.3 | 0 | 0 | 0 | 0 | 0 | 1 | 13 |
| 14 | 12.4 | 10.1 | 8.4 | 13.6 | 1.0 | 5.6 | N | 0.6 | 23 | 8 | 1002.8 | 94.0 | 9.5 | 0 | 0 | 0 | 0 | 0 | 0 | 14 |
| 15 | 15.3 | 6.2 | 3.7 | 13.0 | 1.8 | 0.8 | S | 1.5 | 23 | 8 | 1009.4 | 91.2 | 10.8 | 0 | 0 | 0 | 0 | 0 | 0 | 15 |
| 16 | 14.8 | 9.6 | 6.1 | 13.5 | 0.2 | 7.2 | NW | 0.4 | 14 | 7 | 1008.9 | 91.7 | 11.4 | 0 | 0 | 0 | 0 | 0 | 0 | 16 |
| 17 | 17.7 | 11.3 | 11.0 | 13.9 | 0.4 | 0.1 | NW | 0.9 | 18 | 8 | 1009.7 | 93.1 | 14.7 | 0 | 0 | 0 | 0 | 0 | 0 | 17 |
| 18 | 22.0 | 13.5 | 11.6 | 14.6 | 10.1 | 0.4 | SW | 6.2 | 32 | 1 | 1007.4 | 79.9 | 15.5 | 0 | 0 | 0 | 0 | 0 | 0 | 18 |
| 19 | 17.3 | 7.6 | 6.0 | 15.0 | 11.3 | 0.0 | SW | 5.4 | 30 | 2 | 1008.4 | 69.9 | 12.6 | 0 | 0 | 0 | 0 | 0 | 0 | 19 |
| 20 | 18.1 | 6.3 | 2.6 | 14.5 | 7.7 | 0.0 | N | 0.1 | 12 | 1 | 1013.3 | 71.2 | 13.0 | 0 | 0 | 0 | 0 | 0 | 0 | 20 |
| 21 | 16.5 | 8.9 | 6.5 | 14.8 | 0.0 | 0.7 | NE | 0.3 | 16 | 8 | 1015.7 | 88.6 | 11.8 | 0 | 0 | 0 | 0 | 0 | 0 | 21 |
| 22 | 22.0 | 9.4 | 6.9 | 14.5 | 13.5 | 0.0 | W | 0.6 | 16 | 3 | 1018.8 | 66.5 | 15.9 | 0 | 0 | 0 | 0 | 0 | 0 | 22 |
| 23 | 23.9 | 11.0 | 7.2 | 15.8 | 11.2 | 0.0 | W | 0.2 | 12 | 0 | 1019.4 | 68.7 | 18.3 | 0 | 0 | 0 | 0 | 0 | 0 | 23 |
| 24 | 24.3 | 15.6 | 13.5 | 17.2 | 5.6 | 0.0 | NE | 0.2 | 21 | 1 | 1012.7 | 73.4 | 20.1 | 0 | 0 | 0 | 0 | 0 | 0 | 24 |
| 25 | 21.4 | 13.1 | 9.6 | 17.7 | 6.3 | TR | NW | 0.5 | 16 | 4 | 1005.7 | 83.6 | 15.3 | 0 | 0 | 0 | 0 | 0 | 0 | 25 |
| 26 | 14.5 | 9.5 | 7.0 | 17.3 | 0.5 | 3.7 | N | 0.3 | 12 | 8 | 1003.0 | 89.0 | 10.9 | 0 | 0 | 0 | 0 | 0 | 0 | 26 |
| 27 | 11.0 | 8.4 | 8.2 | 16.3 | 0.0 | 65.7 | NE | 2.7 | 37 | 8 | 995.4 | 99.5 | 9.0 | 0 | 0 | 0 | 0 | 0 | 0 | 27 |
| 28 | 8.5 | 5.9 | 5.8 | 14.4 | 0.0 | 8.8 | N | 3.2 | 30 | 8 | 1002.3 | 99.7 | 6.2 | 0 | 0 | 0 | 0 | 0 | 0 | 28 |
| 29 | 13.5 | 4.4 | 3.1 | 13.3 | 5.6 | 1.9 | W | 2.3 | 30 | 8 | 1007.1 | 84.0 | 8.2 | 0 | 0 | 0 | 0 | 0 | 0 | 29 |
| 30 | 16.1 | 5.4 | 3.0 | 13.7 | 2.7 | 0.7 | S | 2.5 | 25 | 8 | 1002.8 | 88.0 | 10.9 | 0 | 0 | 0 | 0 | 0 | 0 | 30 |
| 31 | 18.7 | 8.2 | 6.5 | 13.8 | 9.1 | TR | S | 1.6 | 21 | 2 | 1006.2 | 81.6 | 13.7 | 0 | 0 | 0 | 0 | 0 | 0 | 31 |
| Total/Mean | 17.1 | 8.6 | 6.7 | 14.5 | 143.8 | 147.5 | X | 2.4 | X | 5.5 | 1008.4 | 83.4 | 12.3 | 0 | 0 | 0 | 0 | 0 | 1 | Total/Mean |
| *Diff./% | +0.1 | +1.2 | 76% | 314% | *Diff./% | |||||||||||||||
| Date | Max. Temp. (°C) 09/09h | Min. Temp. (°C) 09/09h | Grass Min. Temp. (°C) 21/09h | Earth (30cms) Temp. (°C) 09h | Sun (Hours) 00/00h | R'fall (MM) 09/09h | Wind Dir'n 09h | Mean Wind Speed (MPH) 00/00h | Max. Gust Speed (MPH) 00/00h | Cloud Cover (Oktas) 09h | Mean MSL Air Pressure (mB) 00/00h | Mean Rel. Humd. (%) 00/00h | Mean Temp. (°C) 00/00h | Fog (vis. <1000m @ 09h) | Fog (vis. <200m @ 09h) | Snow or Rain and Snow 00/00h | Snow Lying @ 09h (>50% cover) | Hail 00/00h | Thunder 00/00h | Date |
Differences from average:
Differences from average shown in red. Reference periods used are as follows: Temperature 30 Years 1976/2005; rainfall 30 Years 1971/2000; sunshine 30 Years 1971/2000.
(*The differences from average quoted during the course of the month relate to the cumulative daily averages up to the date of the last observation, not the averages for the month as a whole)
Additional Data:
Rainfall Duration 122.6 hours
Air Frost Duration NIL hours
Graphs and Charts:
Click on the following links to view this month's graphs and charts.....
1. Daily Maximum, Minimum & Grass Minimum Temperatures
2. Daily Maximum & Minimum Temperatures (with 30 Year Comparative Means)
3. Daily Earth (30 cms Depth) Temperature @ 0900 GMT 4. Daily Rainfall 5. Daily Sunshine
6. Daily Maximum Gust & Mean Wind Speed 7. Daily Wind Direction @ 0900 GMT
8. Daily Mean MSL Air Pressure 9. Daily Mean Relative Humidity 10. Thermograph
11. Barograph 12. Hygrograph 13. Anemograph 14. Wind Direction
15. Sunshine Duration 16. Rainfall Intensity & Duration
May 2007 Weather Review:
......and click on the link below for a text report of the May 2007 weather in Royston
May (since 1972) at Royston (Iceni) Weather Station:
Mean daily maximum temperature (30 years 1976/2005) 17.0°C
Mean daily minimum temperature (30 years 1976/2005) 7.4°C
Highest temperature 30.3°C (27th May 2005); lowest temperature -1.0°C (16th May1996)
Lowest grass minimum temperature -5.2°C (16th May 1996)
Warmest May 1992 (Mean temperature 14.5°C); coldest May 1984, 1996 (Mean temperature 9.7°C)
Average May rainfall (30 years 1971/2000) 47.0 mm
Wettest May 1983 (Rainfall 125.2 mm); driest May 1990 (Rainfall 3.7 mm)
Wettest Day 5th May 1978 (Rainfall 52.5 mm);
Highest number of "rain days" (0.2 mm or more) 22 (1983); lowest number of "rain days" 3 (1990)
Highest number of days with thunder 8 (1983)
Highest number of air frosts 4 (1996)
Highest number of ground frosts 14 (1996)
Highest number of days with snow falling 2 (1997)
Highest number of days with snow lying (ground with more than 50% snow cover @ 0900 GMT) 0
|
|
|
|
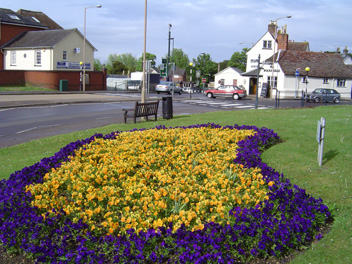
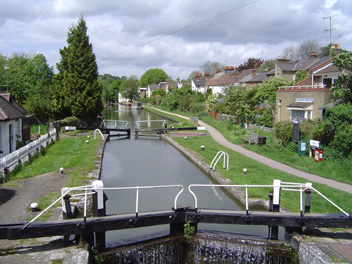
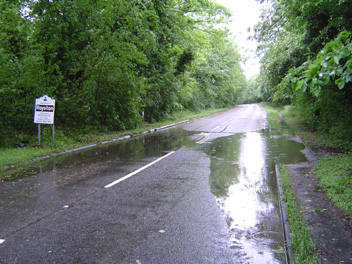
| At the foot of the long descent of the A10 London Road into Royston the road veers from its old route along the High Street and makes a right angle turn to follow its 'new' route around the Priory Gardens. This picture taken at 1607 GMT on 12th May 2007 shows a 'Royston in Bloom' flowerbed just beyond this turn, opposite the Chequers P. H. The Statutory and Old Charter markets are held in the area just behind the building on the left of the picture, whilst the Boar's Head P. H. and the Green Man P. H. are in the background to the right. The temperature is 14.5°C in a SW wind, mean speed 7 knots gusting to 18 knots. | Some 48 km SW of Royston is the Hertfordshire town of Berkhamsted and this picture shows a northward view of the Grand Union Canal which runs through the town ('The Port of Berkhamsted'). This was the view at 1222 GMT on 19th May 2007. Navigation from London to the Midlands and beyond is possible along this route. The West Coast main line railway runs parallel to the Canal at this point a few metres to the right, and the Castle is situated just beyond the railway. The day was one of sunshine and variable cloud and at Royston total sunshine of 11.3 hours was recorded. The maximum temperature at Royston was 17.3°C. | The approach from the east into Royston along the Newmarket Road is down a hill and in this dip prior to a further descent rainwater has flooded the road and footway (as seen at 0842 GMT on 28th May 2007). An exceptionally high rainfall of 65.7 millimetres in the previous 24 hours combined with some blocked roadside drains has resulted in water cascading down the hill to collect at this point. In fact, 27th was the wettest May day since at least 1972 in Royston, the previous wettest in this period being 5th May 1978 (52.5 millimetres rainfall). The 28th experienced a very low daylight maximum temperature of 7.0°C, and no sunshine was recorded. |
Return to Welcome to Royston (Iceni) Weather Station page
(This page last updated 11th June 2007 1955 GMT)