Royston (Iceni) Weather Station
Daily Weather Observations - March 2007
(All Times GMT)
| Date | Max. Temp. (°C) 09/09h | Min. Temp. (°C) 09/09h | Grass Min. Temp. (°C) 21/09h | Earth (30cms) Temp. (°C) 09h | Sun (Hours) 00/00h | R'fall (MM) 09/09h | Wind Dir'n 09h | Mean Wind Speed (MPH) 00/00h | Max. Gust Speed (MPH) 00/00h | Cloud Cover (Oktas) 09h | Mean MSL Air Pressure (mB) 00/00h | Mean Rel. Humd. (%) 00/00h | Mean Temp. (°C) 00/00h | Fog (vis. <1000m @ 09h) | Fog (vis. <200m @ 09h) | Snow or Rain and Snow 00/00h | Snow Lying @ 09h (>50% cover) | Hail 00/00h | Thunder 00/00h | Date |
| 1 | 10.3 | 4.4 | 1.0 | 7.5 | 4.7 | 0.2 | SW | 8.3 | 44 | 1 | 990.1 | 77.4 | 6.6 | 0 | 0 | 0 | 0 | 0 | 0 | 1 |
| 2 | 11.7 | 2.0 | -1.9 | 7.2 | 8.3 | 10.7 | SW | 2.8 | 32 | 0 | 999.9 | 83.2 | 6.1 | 0 | 0 | 0 | 0 | 0 | 0 | 2 |
| 3 | 13.0 | 2.9 | 2.7 | 7.1 | 6.1 | 0.1 | SW | 4.0 | 30 | 7 | 1002.3 | 87.6 | 7.0 | 0 | 0 | 0 | 0 | 0 | 0 | 3 |
| 4 | 11.2 | 4.0 | 1.3 | 7.2 | 0.0 | 7.3 | SE | 4.8 | 35 | 8 | 1004.8 | 97.2 | 7.6 | 0 | 0 | 0 | 0 | 0 | 0 | 4 |
| 5 | 12.0 | 5.4 | 2.8 | 7.5 | 6.7 | 3.7 | SW | 9.1 | 51 | 1 | 1003.3 | 81.9 | 8.4 | 0 | 0 | 0 | 0 | 0 | 0 | 5 |
| 6 | 14.4 | 8.8 | 7.0 | 7.8 | 8.7 | 0.3 | SW | 6.6 | 46 | 2 | 993.9 | 80.4 | 10.1 | 0 | 0 | 0 | 0 | 0 | 0 | 6 |
| 7 | 11.8 | 5.6 | 3.3 | 8.0 | 4.5 | 0.0 | W | 1.5 | 18 | 6 | 999.5 | 82.3 | 7.7 | 0 | 0 | 0 | 0 | 0 | 0 | 7 |
| 8 | 14.0 | 3.6 | -2.0 | 7.9 | 8.4 | 1.8 | W | 1.5 | 23 | 0 | 1018.1 | 79.3 | 8.1 | 0 | 0 | 0 | 0 | 0 | 0 | 8 |
| 9 | 11.5 | 7.0 | 5.1 | 8.0 | 7.5 | 0.3 | NW | 4.3 | 32 | 4 | 1024.4 | 79.2 | 8.1 | 0 | 0 | 0 | 0 | 0 | 0 | 9 |
| 10 | 13.8 | 4.0 | 0.3 | 7.9 | 7.9 | 0.0 | SW | 5.3 | 28 | 1 | 1033.1 | 80.4 | 8.5 | 0 | 0 | 0 | 0 | 0 | 0 | 10 |
| 11 | 16.5 | 4.5 | 2.0 | 7.9 | 9.7 | 0.0 | S | 5.8 | 32 | 2 | 1026.9 | 75.2 | 9.7 | 0 | 0 | 0 | 0 | 0 | 0 | 11 |
| 12 | 17.5 | 6.4 | 3.1 | 7.9 | 7.3 | 0.0 | S | 3.1 | 23 | 1 | 1022.1 | 76.6 | 10.3 | 0 | 0 | 0 | 0 | 0 | 0 | 12 |
| 13 | 14.8 | 4.1 | -1.9 | 8.2 | 10.2 | 0.0 | W | 0.7 | 16 | 5 | 1028.4 | 71.4 | 8.5 | 0 | 0 | 0 | 0 | 0 | 0 | 13 |
| 14 | 15.0 | 4.4 | -1.6 | 8.1 | 9.0 | 0.0 | W | 0.2 | 12 | 0 | 1033.1 | 75.5 | 9.0 | 0 | 0 | 0 | 0 | 0 | 0 | 14 |
| 15 | 12.9 | 5.1 | 1.5 | 8.2 | 6.1 | 0.0 | SW | 2.5 | 18 | 0 | 1026.7 | 80.3 | 8.8 | 0 | 0 | 0 | 0 | 0 | 0 | 15 |
| 16 | 13.1 | 3.5 | -1.4 | 8.5 | 8.4 | 0.0 | W | 3.5 | 25 | 0 | 1024.2 | 73.9 | 8.4 | 0 | 0 | 0 | 0 | 0 | 0 | 16 |
| 17 | 15.5 | 8.0 | 6.5 | 8.9 | 3.9 | 1.5 | W | 9.0 | 41 | 8 | 1017.2 | 80.7 | 10.5 | 0 | 0 | 0 | 0 | 0 | 0 | 17 |
| 18 | 9.4 | 6.3 | 4.1 | 9.2 | 7.7 | 1.6 | W | 11.7 | 51 | 1 | 998.8 | 76.3 | 6.2 | 0 | 0 | 1 | 0 | 1 | 0 | 18 |
| 19 | 8.8 | 0.4 | -1.4 | 8.4 | 5.4 | 2.6 | NW | 4.3 | 35 | 4 | 996.0 | 82.6 | 3.0 | 0 | 0 | 1 | 0 | 1 | 0 | 19 |
| 20 | 6.0 | 1.0 | -1.0 | 8.0 | 3.3 | 1.8 | N | 5.8 | 37 | 3 | 1011.0 | 88.2 | 2.3 | 0 | 0 | 1 | 0 | 1 | 0 | 20 |
| 21 | 8.8 | -1.5 | -4.0 | 7.4 | 7.0 | TR | N | 1.7 | 25 | 1 | 1017.5 | 79.3 | 2.3 | 0 | 0 | 0 | 0 | 0 | 0 | 21 |
| 22 | 5.9 | -0.4 | -5.6 | 7.0 | 0.0 | 0.9 | W | 0.2 | 12 | 8 | 1017.2 | 87.8 | 2.8 | 0 | 0 | 1 | 0 | 0 | 0 | 22 |
| 23 | 8.0 | 3.5 | 3.5 | 7.0 | 0.1 | TR | N | 2.2 | 23 | 8 | 1016.2 | 92.4 | 5.2 | 0 | 0 | 0 | 0 | 0 | 0 | 23 |
| 24 | 9.0 | 1.0 | -2.5 | 7.0 | 0.0 | 0.5 | N | 2.0 | 30 | 8 | 1018.1 | 98.9 | 4.6 | 0 | 0 | 0 | 0 | 0 | 0 | 24 |
| 25 | 13.1 | 5.5 | 5.1 | 7.1 | 6.7 | 0.1 | NE | 1.0 | 21 | 2 | 1018.2 | 85.7 | 7.7 | 0 | 0 | 0 | 0 | 0 | 0 | 25 |
| 26 | 16.0 | 0.6 | -1.9 | 7.5 | 8.4 | 0.0 | NE | 0.4 | 18 | 8 | 1018.2 | 84.3 | 7.2 | 1 | 0 | 0 | 0 | 0 | 0 | 26 |
| 27 | 17.0 | 1.0 | -2.4 | 8.0 | 7.5 | 0.0 | NW | 0.1 | 12 | 8 | 1014.5 | 83.3 | 7.3 | 1 | 1 | 0 | 0 | 0 | 0 | 27 |
| 28 | 12.4 | 1.4 | -2.6 | 8.2 | 4.7 | 0.2 | NW | 0.1 | 9 | 8 | 1012.4 | 91.4 | 6.5 | 1 | 1 | 0 | 0 | 0 | 0 | 28 |
| 29 | 8.2 | 6.0 | 2.5 | 8.4 | 0.4 | 2.6 | NW | 0.5 | 16 | 8 | 1009.4 | 94.9 | 6.4 | 0 | 0 | 0 | 0 | 0 | 0 | 29 |
| 30 | 11.1 | 5.0 | 3.2 | 8.3 | 0.1 | TR | NE | 2.1 | 23 | 8 | 1012.0 | 91.1 | 7.1 | 0 | 0 | 0 | 0 | 0 | 0 | 30 |
| 31 | 14.6 | 6.1 | 5.7 | 8.5 | 8.7 | 0.0 | NE | 4.5 | 32 | 0 | 1021.5 | 81.6 | 8.9 | 0 | 0 | 0 | 0 | 0 | 0 | 31 |
| Total/Mean | 12.2 | 3.9 | 1.0 | 7.9 | 177.1 | 36.2 | X | 3.5 | X | 3.9 | 1013.8 | 83.2 | 7.1 | 3 | 2 | 4 | 0 | 3 | 0 | Total/Mean |
| *Diff./% | +1.8 | +0.4 | 166% | 85% | *Diff./% | |||||||||||||||
| Date | Max. Temp. (°C) 09/09h | Min. Temp. (°C) 09/09h | Grass Min. Temp. (°C) 21/09h | Earth (30cms) Temp. (°C) 09h | Sun (Hours) 00/00h | R'fall (MM) 09/09h | Wind Dir'n 09h | Mean Wind Speed (MPH) 00/00h | Max. Gust Speed (MPH) 00/00h | Cloud Cover (Oktas) 09h | Mean MSL Air Pressure (mB) 00/00h | Mean Rel. Humd. (%) 00/00h | Mean Temp. (°C) 00/00h | Fog (vis. <1000m @ 09h) | Fog (vis. <200m @ 09h) | Snow or Rain and Snow 00/00h | Snow Lying @ 09h (>50% cover) | Hail 00/00h | Thunder 00/00h | Date |
Differences from average:
Differences from average shown in red. Reference periods used are as follows: Temperature 30 Years 1976/2005; rainfall 30 Years 1971/2000; sunshine 30 Years 1971/2000.
(*The differences from average quoted during the course of the month relate to the cumulative daily averages up to the date of the last observation, not the averages for the month as a whole)
Additional Data:
Rainfall Duration 42.4 hours
Air Frost Duration 9.7 hours
Graphs and Charts:
Click on the following links to view this month's graphs and charts.....
1. Daily Maximum, Minimum & Grass Minimum Temperatures
2. Daily Maximum & Minimum Temperatures (with 30 Year Comparative Means)
3. Daily Earth (30 cms Depth) Temperature @ 0900 GMT 4. Daily Rainfall 5. Daily Sunshine
6. Daily Maximum Gust & Mean Wind Speed 7. Daily Wind Direction @ 0900 GMT
8. Daily Mean MSL Air Pressure 9. Daily Mean Relative Humidity 10. Thermograph
11. Barograph 12. Hygrograph 13. Anemograph 14. Wind Direction
15. Sunshine Duration 16. Rainfall Intensity & Duration
March 2007 Weather Review:
......and click on the link below for a text report of the March 2007 weather in Royston
March (since 1973) at Royston (Iceni) Weather Station:
Mean day maximum temperature (30 years 1976/2005) 10.4°C
Mean night minimum temperature (30 years 1976/2005) 3.5°C
Highest temperature 21.6°C (17th March 1990); lowest temperature -6.6°C (3rd March 1986)
Lowest grass minimum temperature -13.7°C (3rd March 1986)
Warmest March 1997 (Mean temperature 9.1°C); coldest March 1987 (Mean temperature 4.3°C)
Average March rainfall (30 years 1971/2000) 42.5 mm
Wettest March 1979 (Rainfall 97.8 mm); driest March 1997 (Rainfall 8.1 mm)
Wettest Day 2nd March 1995 (Rainfall 30.1 mm);
Highest number of "rain days" (0.2 mm or more) 25 (1981); lowest number of "rain days" 3 (2003)
Highest number of days with thunder 2 (1986, 1995)
Highest number of air frosts 15 (1987)
Highest number of ground frosts 21 (1987)
Highest number of days with snow falling 11 (1979)
Highest number of days with snow lying (ground with more than 50% snow cover @ 0900 GMT) 4 (1986)
|
|
|
|
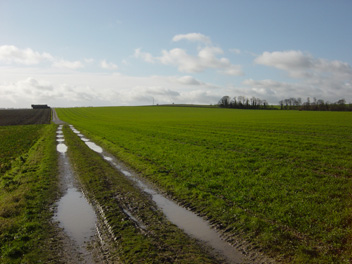
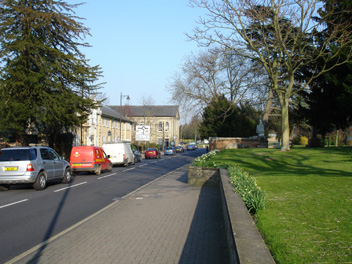
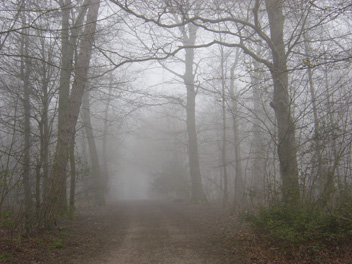
| It is unusual to find puddles of water on this farm track across Lowerfield to the east of Royston but after the wet February and a wet start to March this was the scene on 6th March 2007 (at 0913 GMT). There is now no trace of the devastating fire at this location in the barley and oil seed rape crops on the hottest day last year (19th July) but until the leaves on the trees on the opposite side of the field on the right appear the effect of the scorching of these trees will not be fully clear. At the time of this photograph a SW breeze of mean speed 7 knots gusting to 18 knots is being drawn across the landscape by a complex area of low pressure situated between Iceland and Scotland. The temperature is 10.1°C, later rising to a maximum of 14.4°C. | In this picture late afternoon sunshine bathes Melbourn Street in Royston at 1714 GMT on 26th March 2007. This view is looking eastwards towards the Town Hall at the end of the street with the partially visible 1990 built 'new' police station being visible to the left, whilst to the right of the camera is the Parish Church of St. John the Baptist. As can be seen the daffodils along the edge of the churchyard are all but over although those just around the corner in Melbourn Road are still at their best. The day had begun with thick fog (see next caption) but a clearance by mid-morning allowed sunshine for the rest of the day (total 8.4 hours). The temperature is 14.5°C (after earlier maximum of 16.0°C) and wind direction NE (mean speed 1 knot gusting to 10 knots). | The three mornings of 26th, 27th and 28th March 2007 were all affected by thick fog, somewhat unluckily for Royston since most of the rest of East Anglia was clear of fog and enjoyed unbroken sunshine on all 3 days! Satellite images reveal that on 26th and 27th in particular a 'tongue' of fog stretched eastwards from fog banks in the Midlands along the foot of the Chiltern Hills and East Anglian Heights just as far as Royston, whilst on 28th fog clung to the Greenwich Meridian from Royston northwards until the middle of the day. In this picture taken at 0819 GMT on 28th the trees in Cow Plantation 1.5 km SE of Royston are mitigating the effects of the fog since visibility in the open was considerably less at about 50 metres. The temperature is 2.1°C. |
Return to Welcome to Royston (Iceni) Weather Station page
(This page last updated 11th April 2007 2014 GMT)