Royston (Iceni) Weather Station
Daily Weather Observations - January 2007
(All Times GMT)
| Date | Max. Temp. (°C) 09/09h | Min. Temp. (°C) 09/09h | Grass Min. Temp. (°C) 21/09h | Earth (30cms) Temp. (°C) 09h | Sun (Hours) 00/00h | R'fall (MM) 09/09h | Wind Dir'n 09h | Mean Wind Speed (MPH) 00/00h | Max. Gust Speed (MPH) 00/00h | Cloud Cover (Oktas) 09h | Mean MSL Air Pressure (mB) 00/00h | Mean Rel. Humd. (%) 00/00h | Mean Temp. (°C) 00/00h | Fog (vis. <1000m @ 09h) | Fog (vis. <200m @ 09h) | Snow or Rain and Snow 00/00h | Snow Lying @ 09h (>50% cover) | Hail 00/00h | Thunder 00/00h | Date |
| 1 | 8.5 | 5.5 | 3.4 | 7.5 | 5.3 | 2.8 | W | 8.6 | 44 | 0 | 1009.5 | 84.4 | 6.3 | 0 | 0 | 0 | 0 | 0 | 0 | 1 |
| 2 | 8.3 | 3.0 | 0.5 | 6.6 | 1.4 | 0.2 | SW | 7.4 | 39 | 1 | 1020.1 | 86.3 | 5.6 | 0 | 0 | 0 | 0 | 0 | 0 | 2 |
| 3 | 11.2 | 5.1 | 2.2 | 6.4 | 0.0 | 2.2 | SW | 9.2 | 41 | 8 | 1017.2 | 92.7 | 8.8 | 0 | 0 | 0 | 0 | 0 | 0 | 3 |
| 4 | 10.2 | 7.2 | 4.9 | 7.1 | 4.0 | 0.4 | SW | 8.4 | 39 | 3 | 1008.5 | 86.7 | 8.4 | 0 | 0 | 0 | 0 | 0 | 0 | 4 |
| 5 | 11.3 | 6.8 | 5.5 | 7.0 | 0.0 | 1.0 | SW | 4.1 | 28 | 7 | 1014.2 | 92.5 | 8.6 | 0 | 0 | 0 | 0 | 0 | 0 | 5 |
| 6 | 9.6 | 5.0 | 3.0 | 7.3 | 0.0 | 11.6 | S | 2.4 | 21 | 8 | 1011.6 | 98.1 | 5.9 | 0 | 0 | 0 | 0 | 0 | 0 | 6 |
| 7 | 11.1 | 4.6 | 3.1 | 7.0 | 0.9 | 6.6 | SW | 8.9 | 39 | 8 | 1005.0 | 94.6 | 8.9 | 0 | 0 | 0 | 0 | 0 | 0 | 7 |
| 8 | 13.2 | 5.4 | 3.0 | 7.5 | 0.1 | 0.9 | SW | 8.5 | 39 | 7 | 995.5 | 94.9 | 9.0 | 0 | 0 | 0 | 0 | 0 | 0 | 8 |
| 9 | 13.6 | 11.7 | 10.1 | 7.9 | 0.3 | 12.0 | SW | 15.0 | 51 | 7 | 999.2 | 83.2 | 12.7 | 0 | 0 | 0 | 0 | 0 | 0 | 9 |
| 10 | 10.8 | 9.9 | 8.9 | 8.5 | 2.6 | 4.2 | SW | 8.9 | 39 | 7 | 1007.2 | 87.6 | 8.2 | 0 | 0 | 0 | 0 | 0 | 0 | 10 |
| 11 | 13.0 | 4.9 | 4.0 | 8.0 | 1.0 | 0.7 | SW | 15.5 | 60 | 8 | 1005.8 | 80.8 | 8.9 | 0 | 0 | 0 | 0 | 0 | 0 | 11 |
| 12 | 12.9 | 6.9 | 4.9 | 7.7 | 0.1 | 0.0 | SW | 12.5 | 51 | 8 | 1016.2 | 86.0 | 10.0 | 0 | 0 | 0 | 0 | 0 | 0 | 12 |
| 13 | 11.5 | 9.8 | 8.7 | 8.2 | 0.4 | 0.1 | SW | 9.9 | 46 | 7 | 1013.5 | 88.0 | 10.4 | 0 | 0 | 0 | 0 | 0 | 0 | 13 |
| 14 | 8.1 | 4.0 | 2.0 | 8.1 | 6.5 | 0.0 | SW | 5.1 | 25 | 1 | 1024.5 | 83.3 | 5.8 | 0 | 0 | 0 | 0 | 0 | 0 | 14 |
| 15 | 10.5 | 4.3 | 2.4 | 7.1 | 1.9 | 1.6 | S | 5.5 | 32 | 6 | 1019.2 | 87.6 | 6.8 | 0 | 0 | 0 | 0 | 0 | 0 | 15 |
| 16 | 11.5 | 8.6 | 6.9 | 7.1 | 0.0 | 5.7 | S | 5.1 | 25 | 8 | 1010.6 | 98.8 | 9.8 | 0 | 0 | 0 | 0 | 0 | 0 | 16 |
| 17 | 13.3 | 9.2 | 7.2 | 7.9 | 1.4 | 6.4 | SW | 8.8 | 41 | 8 | 1002.1 | 87.7 | 8.7 | 0 | 0 | 0 | 0 | 0 | 0 | 17 |
| 18 | 13.8 | 6.2 | 5.1 | 7.7 | 1.8 | 1.4 | SW | 15.3 | 67 | 8 | 990.0 | 83.3 | 10.1 | 0 | 0 | 0 | 0 | 0 | 0 | 18 |
| 19 | 13.2 | 8.4 | 5.5 | 8.0 | 5.7 | 2.2 | W | 9.0 | 37 | 1 | 1008.7 | 85.6 | 10.5 | 0 | 0 | 0 | 0 | 0 | 0 | 19 |
| 20 | 10.0 | 8.3 | 6.5 | 8.2 | 6.5 | 0.2 | SW | 11.5 | 46 | 5 | 1005.5 | 82.5 | 8.9 | 0 | 0 | 0 | 0 | 0 | 0 | 20 |
| 21 | 7.7 | 3.8 | 1.3 | 7.5 | 5.9 | 0.3 | SW | 8.7 | 46 | 1 | 1006.2 | 80.3 | 5.1 | 0 | 0 | 0 | 0 | 0 | 0 | 21 |
| 22 | 5.8 | 2.1 | 0.3 | 6.8 | 2.1 | 0.3 | NE | 2.7 | 30 | 8 | 1016.5 | 87.1 | 2.3 | 0 | 0 | 1 | 0 | 0 | 0 | 22 |
| 23 | 2.5 | -2.2 | -6.5 | 6.0 | 3.2 | 1.2 | N | 1.0 | 25 | 6 | 1019.0 | 92.6 | -0.1 | 0 | 0 | 1 | 0 | 0 | 0 | 23 |
| 24 | 4.0 | -2.1 | -5.5 | 5.2 | 3.8 | 0.1 | NW | 0.3 | 16 | 8 | 1011.2 | 95.4 | 0.6 | 0 | 0 | 1 | 1 | 0 | 0 | 24 |
| 25 | 4.6 | -3.1 | -7.7 | 4.8 | 7.3 | 0.0 | CALM | 0.1 | 14 | 1 | 1024.2 | 85.9 | -0.6 | 0 | 0 | 0 | 0 | 0 | 0 | 25 |
| 26 | 6.7 | -1.5 | -5.2 | 4.0 | 1.0 | 0.8 | W | 1.9 | 18 | 8 | 1022.0 | 88.9 | 3.4 | 0 | 0 | 0 | 0 | 0 | 0 | 26 |
| 27 | 8.1 | 2.0 | -1.0 | 4.4 | 2.4 | 0.0 | W | 1.2 | 21 | 2 | 1029.6 | 92.5 | 5.0 | 0 | 0 | 0 | 0 | 0 | 0 | 27 |
| 28 | 9.0 | 4.6 | 3.6 | 5.0 | 0.9 | 0.0 | W | 5.4 | 32 | 7 | 1026.1 | 81.9 | 6.7 | 0 | 0 | 0 | 0 | 0 | 0 | 28 |
| 29 | 9.9 | 6.0 | 2.8 | 5.5 | 4.0 | 0.0 | W | 0.8 | 14 | 5 | 1025.2 | 91.2 | 7.4 | 0 | 0 | 0 | 0 | 0 | 0 | 29 |
| 30 | 8.1 | 6.2 | 5.1 | 6.0 | 0.0 | 0.0 | W | 0.6 | 14 | 8 | 1024.0 | 84.0 | 6.4 | 0 | 0 | 0 | 0 | 0 | 0 | 30 |
| 31 | 10.3 | 1.6 | -1.1 | 6.0 | 7.8 | 0.0 | SW | 4.5 | 28 | 1 | 1021.0 | 88.3 | 5.8 | 0 | 0 | 0 | 0 | 0 | 0 | 31 |
| Total/Mean | 9.8 | 4.9 | 2.7 | 6.8 | 78.2 | 62.9 | X | 6.7 | X | 5.5 | 1013.2 | 88.2 | 6.9 | 0 | 0 | 3 | 1 | 0 | 0 | Total/Mean |
| *Diff./% | +3.2 | +2.8 | 141% | 123% | *Diff./% | |||||||||||||||
| Date | Max. Temp. (°C) 09/09h | Min. Temp. (°C) 09/09h | Grass Min. Temp. (°C) 21/09h | Earth (30cms) Temp. (°C) 09h | Sun (Hours) 00/00h | R'fall (MM) 09/09h | Wind Dir'n 09h | Mean Wind Speed (MPH) 00/00h | Max. Gust Speed (MPH) 00/00h | Cloud Cover (Oktas) 09h | Mean MSL Air Pressure (mB) 00/00h | Mean Rel. Humd. (%) 00/00h | Mean Temp. (°C) 00/00h | Fog (vis. <1000m @ 09h) | Fog (vis. <200m @ 09h) | Snow or Rain and Snow 00/00h | Snow Lying @ 09h (>50% cover) | Hail 00/00h | Thunder 00/00h | Date |
Differences from average:
Differences from average shown in red. Reference periods used are as follows: Temperature 30 Years 1976/2005; rainfall 30 Years 1971/2000; sunshine 30 Years 1971/2000.
(*The differences from average quoted during the course of the month relate to the cumulative daily averages up to the date of the last observation, not the averages for the month as a whole)
Additional Data:
Rainfall Duration 52.4 hours
Air Frost Duration 44.0 hours
Graphs and Charts:
Click on the following links to view this month's graphs and charts.....
1. Daily Maximum, Minimum & Grass Minimum Temperatures
2. Daily Maximum & Minimum Temperatures (with 30 Year Comparative Means)
3. Daily Earth (30 cms Depth) Temperature @ 0900 GMT 4. Daily Rainfall 5. Daily Sunshine
6. Daily Maximum Gust & Mean Wind Speed 7. Daily Wind Direction @ 0900 GMT
8. Daily Mean MSL Air Pressure 9. Daily Mean Relative Humidity 10. Thermograph
11. Barograph 12. Hygrograph 13. Anemograph 14. Wind Direction
15. Sunshine Duration 16. Rainfall Intensity & Duration
January 2007 Weather Review:
......and click on the link below for a text report of the January 2007 weather in Royston
January (since 1973) at Royston (Iceni) Weather Station:
Mean day maximum temperature (30 years 1976/2005) 6.6°C
Mean night minimum temperature (30 years 1976/2005) 2.1°C
Highest temperature 14.2°C (6th January 1999); lowest temperature -12.7°C (14th January 1982)
Lowest grass minimum temperature -18.1°C (10th January 1982)
Warmest January 1983, 1990 (Mean temperature 6.9°C); coldest January 1979 (Mean temperature 0.1°C)
Average January rainfall (30 years 1971/2000) 51.2 mm
Wettest January 1995 (Rainfall 108.2 mm); driest January 1987 (Rainfall 9.6 mm)
Wettest Day 9th January 1992 (Rainfall 25.1 mm);
Highest number of "rain days" (0.2 mm or more) 25 (1988, 2004); lowest number of "rain days" 9 (1992)
Highest number of days with thunder 1 (1974, 1984. 1988, 1994, 1998 and 2004)
Highest number of air frosts 20 (1979, 1985)
Highest number of ground frosts 25 (1979)
Highest number of days with snow falling 15 (1985)
Highest number of days with snow lying (ground with more than 50% snow cover @ 0900 GMT) 17 (1985)
|
|
|
|
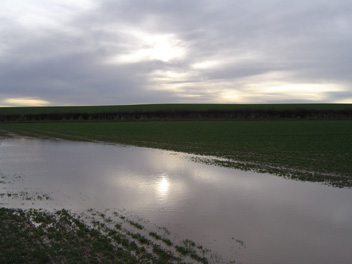
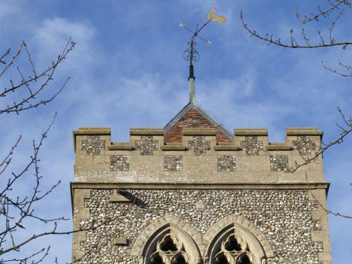
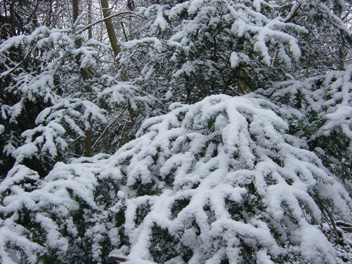
| This is a most unusual sight on the well drained chalk soils around Royston but heavy rainfall at the end of December and early January has accumulated to form a small 'lake' in a slight depression near Heath Farm some 2 km SE of the town. The picture above was taken at 0938 GMT on 8th January 2007. Chalk soils can become compacted and temporarily impede drainage and this is presumably what has happened here but as expected the water soon dispersed. This day was exceptionally mild for January, the temperature reaching a maximum of 13.2°C (despite only 2 minutes sunshine for the day!), no less than 6.6°C above the 30 Year (1976/2005) average. | The tower of Therfield Church (approximately 6 km SSW of Royston) was here photographed at 1420 GMT on 21st January 2007. A close inspection of this picture reveals that the mast supporting the wind vane on top of the tower has been bent through an angle of 45°, presumably in one of the recent gales experienced in the area. Gales occurred on the successive Thursdays of 11th and 18th January 2007, daily maximum gust speeds of 60 mph and 67 mph respectively having been recorded at Royston. Wind speeds at Therfield would most likely have been higher than this due to the increased elevation (about 160m) of the village. (Photo: Ian Hirst) | The first snowfall of the 2006/2007 Winter season at Royston occurred as late as 24th January and this was the scene in Bury Plantation on the eastern perimeter of the town at 0946 GMT after a light snowfall in the early hours. The temperature is 0.1°C after an overnight minimum of -2.1°C, whilst a light north-westerly wind has allowed the snow to settle on the branches of trees and shrubs. The snow was not to last, however, as 2 hours after this photograph was taken the sky cleared from the N and a rapid thaw ensued in the bright sunshine which followed (3.8 hours for the day). Later the same day the snow had all but disappeared! |
Return to Welcome to Royston (Iceni) Weather Station page
(This page last updated 12th February 2007 2124 GMT)