Royston (Iceni) Weather Station
Daily Weather Observations - JULY 2006
(All Times GMT)
| Date | Max. Temp. (°C) 09/09h | Min. Temp. (°C) 09/09h | Grass Min. Temp. (°C) 21/09h | Earth (30cms) Temp. (°C) 09h | Sun (Hours) 00/00h | R'fall (MM) 09/09h | Wind Dir'n 09h | Mean Wind Speed (MPH) 00/00h | Max. Gust Speed (MPH) 00/00h | Cloud Cover (Oktas) 09h | Mean MSL Air Pressure (mB) 00/00h | Mean Rel. Humd. (%) 00/00h | Mean Temp. (°C) 00/00h | Fog (vis. <1000m @ 09h) | Fog (vis. <200m @ 09h) | Snow or Rain and Snow 00/00h | Snow Lying @ 09h (>50% cover) | Hail 00/00h | Thunder 00/00h | Date |
| 1 | 28.5 | 15.0 | 12.9 | 19.4 | 15.5 | 0.0 | SE | 0.9 | 14 | 1 | 1021.9 | 56.9 | 22.0 | 0 | 0 | 0 | 0 | 0 | 0 | 1 |
| 2 | 30.8 | 18.0 | 15.5 | 20.3 | 12.7 | 0.0 | SE | 0.7 | 21 | 2 | 1017.8 | 54.0 | 23.9 | 0 | 0 | 0 | 0 | 0 | 0 | 2 |
| 3 | 31.0 | 14.5 | 12.5 | 20.6 | 16.1 | 0.0 | NE | 0.5 | 18 | 0 | 1015.1 | 54.2 | 22.5 | 0 | 0 | 0 | 0 | 0 | 0 | 3 |
| 4 | 29.7 | 13.7 | 11.6 | 20.9 | 7.9 | TR | NE | 0.4 | 14 | 0 | 1013.4 | 76.4 | 21.3 | 0 | 0 | 0 | 0 | 0 | 1 | 4 |
| 5 | 24.7 | 15.2 | 13.3 | 21.0 | 2.2 | 0.3 | N | 0.6 | 14 | 4 | 1010.8 | 84.2 | 19.9 | 0 | 0 | 0 | 0 | 0 | 0 | 5 |
| 6 | 25.0 | 17.0 | 16.1 | 20.6 | 3.5 | 0.0 | SW | 3.0 | 21 | 8 | 1012.4 | 81.4 | 20.3 | 0 | 0 | 0 | 0 | 0 | 0 | 6 |
| 7 | 21.0 | 16.1 | 14.6 | 20.1 | 4.1 | 0.2 | W | 2.8 | 28 | 6 | 1014.7 | 75.7 | 18.6 | 0 | 0 | 0 | 0 | 0 | 0 | 7 |
| 8 | 22.6 | 12.8 | 11.1 | 19.6 | 4.7 | 1.4 | SW | 3.4 | 23 | 3 | 1014.0 | 63.1 | 17.9 | 0 | 0 | 0 | 0 | 0 | 0 | 8 |
| 9 | 22.7 | 13.7 | 12.4 | 19.7 | 4.2 | 0.0 | SW | 7.5 | 37 | 8 | 1009.4 | 76.7 | 17.8 | 0 | 0 | 0 | 0 | 0 | 0 | 9 |
| 10 | 23.5 | 12.9 | 11.1 | 19.3 | 2.9 | 2.0 | SW | 3.0 | 23 | 7 | 1018.9 | 84.3 | 18.1 | 0 | 0 | 0 | 0 | 0 | 0 | 10 |
| 11 | 25.4 | 16.2 | 14.9 | 19.5 | 12.3 | 0.0 | NW | 1.7 | 18 | 6 | 1021.1 | 65.1 | 20.0 | 0 | 0 | 0 | 0 | 0 | 0 | 11 |
| 12 | 27.7 | 12.0 | 9.0 | 19.9 | 15.9 | 0.0 | S | 1.7 | 23 | 0 | 1022.3 | 57.8 | 20.1 | 0 | 0 | 0 | 0 | 0 | 0 | 12 |
| 13 | 23.5 | 13.3 | 10.6 | 20.4 | 7.0 | TR | N | 1.3 | 23 | 8 | 1025.0 | 73.4 | 17.2 | 0 | 0 | 0 | 0 | 0 | 0 | 13 |
| 14 | 23.9 | 8.6 | 5.7 | 19.4 | 14.4 | 0.0 | NE | 2.0 | 23 | 3 | 1031.1 | 68.9 | 16.2 | 0 | 0 | 0 | 0 | 0 | 0 | 14 |
| 15 | 26.5 | 8.4 | 5.5 | 19.6 | 14.0 | 0.0 | NE | 1.2 | 21 | 1 | 1029.8 | 67.0 | 17.5 | 0 | 0 | 0 | 0 | 0 | 0 | 15 |
| 16 | 29.2 | 11.8 | 9.4 | 20.0 | 11.0 | 0.0 | N | 0.3 | 18 | 1 | 1026.0 | 66.1 | 20.3 | 0 | 0 | 0 | 0 | 0 | 0 | 16 |
| 17 | 32.5 | 12.1 | 9.0 | 20.4 | 15.8 | 0.0 | NE | 0.5 | 14 | 1 | 1023.5 | 47.8 | 22.7 | 0 | 0 | 0 | 0 | 0 | 0 | 17 |
| 18 | 32.9 | 13.1 | 9.6 | 20.9 | 15.6 | 0.0 | N | 0.7 | 16 | 0 | 1019.9 | 51.1 | 23.5 | 0 | 0 | 0 | 0 | 0 | 0 | 18 |
| 19 | 35.2 | 15.0 | 12.4 | 21.4 | 13.9 | 0.0 | NE | 1.2 | 18 | 0 | 1014.4 | 52.7 | 25.5 | 0 | 0 | 0 | 0 | 0 | 0 | 19 |
| 20 | 31.6 | 20.7 | 19.5 | 22.1 | 10.8 | 0.0 | SW | 3.9 | 28 | 7 | 1014.2 | 58.3 | 25.2 | 0 | 0 | 0 | 0 | 0 | 0 | 20 |
| 21 | 31.8 | 18.5 | 15.7 | 22.3 | 10.0 | 0.2 | SW | 1.7 | 21 | 0 | 1017.2 | 61.5 | 25.1 | 0 | 0 | 0 | 0 | 0 | 0 | 21 |
| 22 | 30.6 | 19.9 | 18.0 | 22.5 | 3.7 | 2.9 | S | 1.3 | 32 | 6 | 1014.2 | 77.0 | 22.2 | 0 | 0 | 0 | 0 | 0 | 1 | 22 |
| 23 | 26.8 | 17.4 | 15.8 | 21.9 | 7.4 | 0.0 | W | 1.7 | 16 | 6 | 1016.3 | 72.3 | 22.0 | 0 | 0 | 0 | 0 | 0 | 0 | 23 |
| 24 | 29.2 | 13.5 | 11.1 | 21.4 | 12.8 | 0.0 | NE | 0.4 | 16 | 0 | 1019.1 | 62.8 | 21.6 | 0 | 0 | 0 | 0 | 0 | 0 | 24 |
| 25 | 31.5 | 15.0 | 12.4 | 21.5 | 13.4 | 0.0 | E | 1.2 | 18 | 1 | 1016.6 | 64.1 | 23.4 | 0 | 0 | 0 | 0 | 0 | 0 | 25 |
| 26 | 32.6 | 19.5 | 16.9 | 22.0 | 7.2 | 75.5 | E | 1.5 | 30 | 2 | 1014.4 | 72.3 | 24.0 | 0 | 0 | 0 | 0 | 1 | 1 | 26 |
| 27 | 28.5 | 18.6 | 17.2 | 21.9 | 5.7 | 8.9 | E | 1.5 | 23 | 4 | 1013.8 | 78.0 | 21.5 | 0 | 0 | 0 | 0 | 0 | 1 | 27 |
| 28 | 27.6 | 17.5 | 15.5 | 21.6 | 10.2 | 0.0 | NW | 0.1 | 12 | 0 | 1010.0 | 72.9 | 22.0 | 0 | 0 | 0 | 0 | 0 | 0 | 28 |
| 29 | 26.7 | 16.9 | 14.5 | 21.9 | 9.4 | 1.0 | SW | 3.5 | 28 | 2 | 1006.1 | 69.7 | 21.6 | 0 | 0 | 0 | 0 | 0 | 0 | 29 |
| 30 | 25.7 | 16.5 | 15.5 | 22.0 | 8.1 | TR | W | 3.7 | 23 | 6 | 1007.0 | 66.8 | 20.8 | 0 | 0 | 0 | 0 | 0 | 0 | 30 |
| 31 | 23.2 | 16.0 | 14.4 | 21.8 | 5.1 | 1.0 | SW | 5.9 | 32 | 6 | 1006.9 | 71.0 | 19.3 | 0 | 0 | 0 | 0 | 0 | 0 | 31 |
| Total/Mean | 27.8 | 15.1 | 13.0 | 20.8 | 297.2 | 93.4 | X | 1.9 | X | 3.2 | 1016.7 | 67.2 | 21.1 | 0 | 0 | 0 | 0 | 1 | 4 | Total/Mean |
| *Diff./% | +5.5 | +2.5 | 155% | 216% | *Diff./% |
Differences from average:
Differences from average shown in red. Reference periods used are as follows: Temperature 30 Years 1976/2005; rainfall 30 Years 1971/2000; sunshine 30 Years 1971/2000.
(*The differences from average quoted during the course of the month relate to the cumulative daily averages up to the date of the last observation, not the averages for the month as a whole)
Additional Data:
Rainfall Duration 13.5 hours
Air Frost Duration NIL hours
Graphs and Charts:
Click on the following links to view this month's graphs and charts.....
1. Daily Maximum, Minimum & Grass Minimum Temperatures
2. Daily Maximum & Minimum Temperatures (with 30 Year Comparative Means)
3. Daily Earth (30 cms Depth) Temperature @ 0900 GMT 4. Daily Rainfall 5. Daily Sunshine
6. Daily Maximum Gust & Mean Wind Speed 7. Daily Wind Direction @ 0900 GMT
8. Daily Mean MSL Air Pressure 9. Daily Mean Relative Humidity 10. Thermograph
11. Barograph 12. Hygrograph 13. Anemograph 14. Wind Direction
15. Sunshine Duration 16. Rainfall Intensity & Duration
June 2006 Weather Review:
......and click on the link below for a text report of the July 2006 weather in Royston
July (since 1972) at Royston (Iceni) Weather Station:
Mean day maximum temperature (30 years 1976/2005) 22.3°C
Mean night minimum temperature (30 years 1976/2005) 12.6°C
Highest temperature 33.5°C (3rd July 1976); lowest temperature 6.4°C (30th July 1977)
Lowest grass minimum temperature 2.8°C (13th July 1993)
Hottest July 1983 (Mean temperature 20.3°C); coolest July 1978 (Mean temperature 15.2°C)
Average July rainfall (30 years 1971/2000) 43.2 mm
Wettest July 2002 (Rainfall 104.7 mm); driest July 1984 (Rainfall 8.3 mm)
Wettest Day 30th July 2002 (Rainfall 48.8 mm);
Highest number of "rain days" (0.2 mm or more) 20 (1988); lowest number of "rain days" 6 (1976,1977, 1979, 1984, & 1990)
Highest number of days with thunder 6 (1975, 1982,1983 & 2002)
|
|
|
|
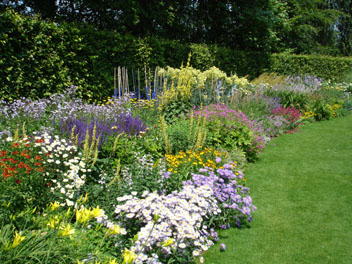
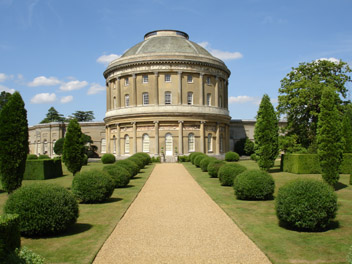
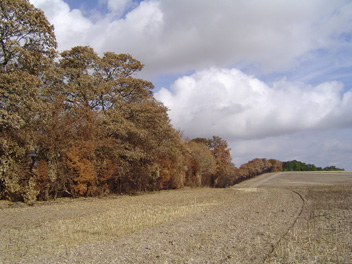
| The Herbaceous Garden at Anglesey Abbey (28 km NE of Royston) must be one of the best of its kind in East Anglia, being formed around a large semi-circular lawn framed by mature beech hedges. This picture shows a part of the curved section (the whole border being over 200 metres long) and is as seen at 1103 GMT on 4th July 2006. A statue (not shown) of the Saxon god 'TIW' by J. M. Rysbrack (1694-1770) is placed at the centre of the pristine green lawn. The many varieties of plants include an impressive display of delphiniums arranged in groups around the border. The day was hot, the maximum temperature at Royston reaching 29.7°C, whilst sunshine for the day was 7.9 hours. | This picture (taken from the terraced walk at 1416 GMT on 11th July 2006) shows the south front of the Rotunda at Ickworth House (50 km ENE of Royston). The extraordinary central Rotunda is but part of Ickworth House, which was created (from 1795) by Frederick, 4th Earl of Bristol and Bishop of Derry and was inspired by the monuments of Rome. Unfortunately the Earl-Bishop's wife was not impressed and condemned Ickworth as a 'stupendous monument of folly'! Apart from varying lighting conditions this particular scene looks much the same at any time of the year given the choice of coniferous shrubs and trees on display. As indicated in the picture it was a sunny day with 12.3 hours sunshine at Royston. | On 19th July 2006 the temperature at Royston reached 35.2°C, its highest value in July since at least 1972. On this day, during harvesting operations at Lowerfield, some 2 km E of Royston, a devastating fire took hold and destroyed about 40 acres of standing barley and oilseed rape, as well as straw awaiting collection and stubble. The fire also badly scorched the mature belt of trees and bushes shown here, and it remains to be seen if the larger specimens can survive this total leaf loss. This photograph was taken 11 days later on 30th July (at 0817 GMT). The blackened appearance of the fields after the fire is not apparent here as torrential rain during an evening thunderstorm on 26th July has largely cleansed the soil. |
Return to Welcome to Royston (Iceni) Weather Station page
(This page last updated 10th August 2006 1944 GMT)