
Royston (Iceni) Weather Station
Daily Weather Observations - July 2003
(All Times GMT)
| Date | Max. Temp. (°C) 09/09h | Min. Temp. (°C) 09/09h | Grass Min. Temp. (°C) 21/09h | Earth (30cms) Temp. (°C) 09h | Sun (Hours) 00/00h | R'fall (MM) 09/09h | Wind Dir'n 09h | Mean Wind Speed (MPH) 00/00h | Max. Gust Speed (MPH) 00/00h | Cloud Cover (Oktas) 09h | Mean MSL Air Pressure (mB) 00/00h | Mean Rel. Humd. (%) 00/00h | Mean Temp. (°C) 00/00h | Fog (vis. <1000m @ 09h) | Fog (vis. <200m @ 09h) | Snow or Rain and Snow 00/00h | Snow Lying @ 09h (>50% cover) | Hail 00/00h | Thunder 00/00h | Date |
| 1 | 18.6 | 12.6 | 12.0 | 18.4 | 1.1 | 6.9 | W | 4.0 | 23 | 8 | 998.8 | 87.5 | 14.6 | 0 | 0 | 0 | 0 | 0 | 0 | 1 |
| 2 | 20.1 | 12.0 | 10.5 | 18.1 | 0.9 | 2.6 | NW | 1.3 | 16 | 8 | 1005.4 | 86.6 | 14.7 | 0 | 0 | 0 | 0 | 0 | 0 | 2 |
| 3 | 17.3 | 12.8 | 12.5 | 18.1 | 0.0 | 2.5 | NW | 2.2 | 16 | 8 | 1011.2 | 94.7 | 13.6 | 0 | 0 | 0 | 0 | 0 | 0 | 3 |
| 4 | 19.6 | 11.7 | 10.3 | 17.5 | 6.2 | 0.0 | W | 3.2 | 18 | 3 | 1015.9 | 77.6 | 15.5 | 0 | 0 | 0 | 0 | 0 | 0 | 4 |
| 5 | 18.1 | 10.4 | 9.3 | 17.8 | 0.0 | TR | W | 1.2 | 12 | 8 | 1019.3 | 86.5 | 14.2 | 0 | 0 | 0 | 0 | 0 | 0 | 5 |
| 6 | 21.8 | 12.7 | 11.4 | 17.6 | 7.3 | 0.0 | N | 0.6 | 14 | 1 | 1021.1 | 65.1 | 17.1 | 0 | 0 | 0 | 0 | 0 | 0 | 6 |
| 7 | 23.1 | 11.5 | 9.0 | 18.4 | 10.4 | 0.0 | W | 2.6 | 16 | 1 | 1022.1 | 67.1 | 17.8 | 0 | 0 | 0 | 0 | 0 | 0 | 7 |
| 8 | 24.2 | 14.3 | 12.7 | 18.8 | 2.5 | 0.0 | W | 3.4 | 18 | 8 | 1021.2 | 72.4 | 19.1 | 0 | 0 | 0 | 0 | 0 | 0 | 8 |
| 9 | 26.6 | 15.4 | 12.9 | 19.0 | 8.9 | 0.0 | NE | 1.2 | 16 | 7 | 1020.5 | 71.6 | 20.8 | 0 | 0 | 0 | 0 | 0 | 0 | 9 |
| 10 | 29.0 | 15.9 | 14.6 | 19.8 | 10.2 | 0.0 | SW | 5.0 | 25 | 3 | 1017.2 | 65.3 | 22.3 | 0 | 0 | 0 | 0 | 0 | 0 | 10 |
| 11 | 22.7 | 15.5 | 14.5 | 20.4 | 10.5 | 0.0 | W | 3.7 | 23 | 5 | 1019.7 | 63.0 | 18.6 | 0 | 0 | 0 | 0 | 0 | 0 | 11 |
| 12 | 25.8 | 11.6 | 8.5 | 19.9 | 15.7 | 0.0 | W | 1.1 | 16 | 2 | 1022.5 | 56.7 | 18.5 | 0 | 0 | 0 | 0 | 0 | 0 | 12 |
| 13 | 26.3 | 13.4 | 11.8 | 20.0 | 16.0 | 0.0 | SE | 2.6 | 18 | 0 | 1020.2 | 54.3 | 19.4 | 0 | 0 | 0 | 0 | 0 | 0 | 13 |
| 14 | 28.9 | 11.6 | 8.9 | 20.0 | 15.9 | 0.0 | E | 0.9 | 21 | 0 | 1015.1 | 60.7 | 20.6 | 0 | 0 | 0 | 0 | 0 | 0 | 14 |
| 15 | 31.0 | 12.4 | 9.9 | 20.4 | 15.5 | 0.0 | NE | 0.9 | 21 | 1 | 1010.0 | 57.0 | 21.9 | 0 | 0 | 0 | 0 | 0 | 0 | 15 |
| 16 | 30.2 | 14.2 | 11.5 | 20.8 | 8.4 | 4.8 | N | 1.8 | 28 | 2 | 1006.2 | 75.3 | 20.5 | 0 | 0 | 0 | 0 | 0 | 1 | 16 |
| 17 | 18.9 | 17.1 | 16.1 | 20.7 | 0.0 | 1.9 | SW | 6.4 | 30 | 8 | 1010.7 | 90.3 | 17.0 | 0 | 0 | 0 | 0 | 0 | 0 | 17 |
| 18 | 24.6 | 15.0 | 14.0 | 19.5 | 7.6 | 0.0 | SW | 6.0 | 28 | 6 | 1018.2 | 70.3 | 19.3 | 0 | 0 | 0 | 0 | 0 | 0 | 18 |
| 19 | 28.8 | 15.1 | 13.5 | 19.6 | 10.4 | 0.4 | S | 4.9 | 30 | 1 | 1016.3 | 65.5 | 21.5 | 0 | 0 | 0 | 0 | 0 | 1 | 19 |
| 20 | 24.7 | 15.2 | 13.4 | 20.4 | 11.5 | 0.0 | SW | 5.0 | 28 | 1 | 1013.1 | 63.1 | 19.4 | 0 | 0 | 0 | 0 | 0 | 0 | 20 |
| 21 | 24.2 | 13.0 | 9.9 | 19.8 | 4.1 | TR | SW | 5.6 | 30 | 4 | 1013.1 | 70.1 | 18.5 | 0 | 0 | 0 | 0 | 0 | 0 | 21 |
| 22 | 25.6 | 14.1 | 13.0 | 19.5 | 8.5 | 0.0 | SW | 5.0 | 23 | 6 | 1017.4 | 67.7 | 19.1 | 0 | 0 | 0 | 0 | 0 | 0 | 22 |
| 23 | 23.8 | 14.8 | 13.4 | 19.7 | 1.4 | 0.6 | SW | 5.8 | 28 | 8 | 1015.2 | 71.4 | 18.6 | 0 | 0 | 0 | 0 | 0 | 0 | 23 |
| 24 | 23.2 | 14.6 | 13.5 | 19.7 | 5.7 | 1.8 | W | 5.5 | 28 | 7 | 1011.8 | 71.7 | 18.3 | 0 | 0 | 0 | 0 | 0 | 0 | 24 |
| 25 | 19.0 | 14.7 | 14.1 | 19.6 | 0.5 | 3.7 | S | 5.4 | 32 | 8 | 1006.2 | 91.1 | 15.7 | 0 | 0 | 0 | 0 | 0 | 0 | 25 |
| 26 | 20.9 | 11.5 | 10.4 | 18.4 | 3.9 | 10.8 | S | 2.9 | 21 | 6 | 1006.7 | 79.9 | 16.4 | 0 | 0 | 0 | 0 | 0 | 0 | 26 |
| 27 | 22.7 | 13.9 | 13.4 | 18.5 | 5.6 | 0.0 | W | 3.6 | 23 | 8 | 1010.1 | 73.5 | 17.0 | 0 | 0 | 0 | 0 | 0 | 0 | 27 |
| 28 | 23.6 | 11.8 | 10.2 | 18.6 | 8.0 | 0.0 | SW | 6.0 | 25 | 2 | 1019.1 | 67.2 | 17.5 | 0 | 0 | 0 | 0 | 0 | 0 | 28 |
| 29 | 22.0 | 15.8 | 14.7 | 19.0 | 0.4 | 1.3 | SW | 6.3 | 25 | 8 | 1017.7 | 84.2 | 17.9 | 0 | 0 | 0 | 0 | 0 | 0 | 29 |
| 30 | 23.5 | 15.9 | 15.0 | 19.0 | 4.0 | 4.5 | NW | 3.9 | 21 | 8 | 1013.6 | 82.2 | 18.5 | 0 | 0 | 0 | 0 | 0 | 1 | 30 |
| 31 | 22.9 | 14.9 | 13.6 | 19.3 | 2.0 | 5.9 | W | 3.6 | 21 | 8 | 1015.8 | 75.7 | 18.4 | 0 | 0 | 0 | 0 | 0 | 0 | 31 |
| Total/Mean | 23.6 | 13.7 | 12.2 | 19.2 | 203.0 | 47.7 | X | 3.6 | X | 5.0 | 1014.6 | 73.1 | 18.1 | 0 | 0 | 0 | 0 | 0 | 3 | Total/Mean |
| *Diff./% | +1.4 | +1.2 | 109% | 110% | *Diff./% |
Differences from average:
Differences from average shown in red. Reference periods used are as follows: Temperature 30 Years 1973/2002; rainfall 30 Years 1971/2000; sunshine 30 Years 1961/1990.
(*The differences from average quoted during the course of the month relate to the cumulative daily averages up to the date of the last observation, not the averages for the month as a whole)
Additional Data:
Rainfall Duration 40.1 hours
Air Frost Duration NIL hours
Graphs and Charts:
Click on the following links to view this month's graphs and charts.....
1. Daily Maximum, Minimum & Grass Minimum Temperatures
2. Daily Maximum & Minimum Temperatures (with 30 Year Comparative Means)
3. Daily Earth (30 cms Depth) Temperature @ 0900 GMT 4. Daily Rainfall 5. Daily Sunshine
6. Daily Maximum Gust & Mean Wind Speed 7. Daily Wind Direction @ 0900 GMT
8. Daily Mean MSL Air Pressure 9. Daily Mean Relative Humidity 10. Thermograph
11. Barograph 12. Hygrograph 13. Anemograph 14. Wind Direction
15. Sunshine Duration 16. Rainfall Intensity & Duration
July 2003 Weather Review:
......and click on the link below for a text report of the July 2003 weather in Royston
July (since 1972) at Royston (Iceni) Weather Station:
Mean day maximum temperature (30 years 1973/2002) 22.2°C
Mean night minimum temperature (30 years 1973/2002) 12.5°C
Highest temperature 33.5°C (3rd July 1976); lowest temperature 6.4°C (30th July 1977)
Lowest grass minimum temperature 2.8°C (13th July 1993)
Hottest July 1983 (Mean temperature 20.3°C); coolest July 1978 (Mean temperature 15.2°C)
Average July rainfall (35 years 1971/2000) 43.2 mm
Wettest July 2002 (Rainfall 104.7 mm); driest July 1984 (Rainfall 8.3 mm)
Wettest Day 30th July 2002 (Rainfall 48.8 mm);
Highest number of "rain days" (0.2 mm or more) 20 (1988); lowest number of "rain days" 6 (1976,1977, 1979, 1984, & 1990)
Highest number of days with thunder 6 (1975, 1982,1983 & 2002)
|
|
|
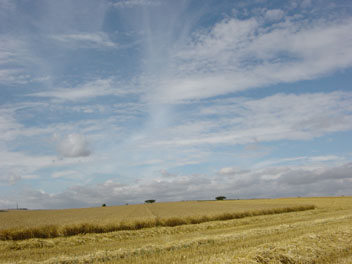
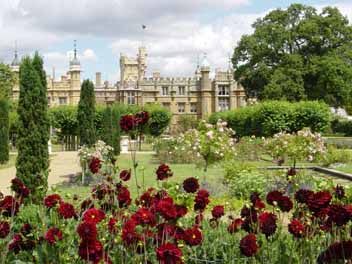
| The Wimpole Estate some 10 km N of Royston features a fine expanse of gardens (as seen here at 1022 GMT on 19th July 2003).situated between Wimpole Hall and the large area of park and grazing land, the start of which can be seen in the upper part of the photograph. The temperature at this time was already as high as 26.6°C at Royston, not far from the day's maximum temperature of 28.8°C. A SSW wind of mean speed 6 knots, gusting to 22 knots, was in evidence at Royston. The hot day followed a warm night with a minimum temperature of 15.1°C, and total sunshine for the day was 10.4 hours. | Harvesting of the barley crop in the rolling expanses to the south-east of Royston was well under way when this scene was viewed at 0842 GMT on 21st July 2003. The straw from the crop was quickly baled up after harvesting and taken away by road transporter, possibly on its way to the dairy farmers on the western side of the country. A band of thicker advancing cloud can be seen close to the horizon and sunshine for the day was restricted to 4.1 hours. The temperature at the time of the photograph was a pleasant 20.5°C but accompanied by a rather fresh SSW breeze of mean speed 9 knots, gusting to 20 knots. | Situated some 23 km to the SW of Royston is Knebworth House, as seen here from the adjacent gardens at 1321 GMT on 22nd July 2003. The present House dates back to 1843 when the original Tudor manor house was transformed into a Gothic fantasy with turrets, griffins and gargoyles. This was a day of clear air and distinctive cumulus cloud formations gradually building up to a more general cloud cover but not before a sunshine total of 8.5 hours had been accumulated (at Royston). The maximum temperature for the day at Royston was 25.6°C, after an overnight minimum of 14.1°C. |
Return to Welcome to Royston (Iceni) Weather Station page
(This page last updated 12th August 2003 2031 GMT)