
Royston (Iceni) Weather Station
Daily Weather Observations - January 2003
(All Times GMT)
| Date | Max. Temp. (°C) 09/09h | Min. Temp. (°C) 09/09h | Grass Min. Temp. (°C) 21/09h | Earth (30cms) Temp. (°C) 09h | Sun (Hrs) 00/00h | R'fall (MM) 09/09h | Wind Dir'n 09h | Mean Wind Speed (MPH) 00/00h | Max. Gust Speed (MPH) 00/00h | Cloud Cover (Oktas) 09h | Mean MSL Air Pressure (mB) 00/00h | Mean Rel. Humd. (%) 00/00h | Mean Temp. (°C) 00/00h | Fog (vis. <1000m @ 09h) | Fog (vis. <200m @ 09h) | Snow or Rain and Snow 00/00h | Snow Lying @ 09h (>50% cover) | Hail 00/00h | Thunder 00/00h | Date |
| 1 | 11.5 | 2.4 | 2.1 | 6.9 | 0.0 | 23.0 | SE | 6.9 | 30 | 8 | 994.7 | 97.4 | 7.3 | 0 | 0 | 0 | 0 | 0 | 0 | 1 |
| 2 | 7.6 | 7.3 | 5.5 | 7.3 | 0.0 | 11.8 | NE | 4.5 | 25 | 8 | 985.6 | 97.3 | 6.9 | 0 | 0 | 0 | 0 | 0 | 0 | 2 |
| 3 | 5.0 | 4.6 | 1.5 | 7.1 | 0.0 | 0.8 | N | 2.1 | 23 | 8 | 997.9 | 97.1 | 2.9 | 0 | 0 | 0 | 0 | 0 | 0 | 3 |
| 4 | 3.4 | -0.5 | -3.2 | 6.3 | 4.2 | 0.0 | NE | 1.7 | 16 | 5 | 1013.5 | 92.3 | 0.2 | 0 | 0 | 1 | 0 | 1 | 0 | 4 |
| 5 | 1.6 | -2.2 | -6.4 | 5.1 | 2.8 | TR | W | 0.6 | 12 | 7 | 1015.8 | 94.5 | -0.6 | 0 | 0 | 0 | 0 | 0 | 0 | 5 |
| 6 | 2.8 | -2.1 | -6.5 | 4.4 | 5.4 | 0.0 | NE | 0.9 | 18 | 0 | 1019.2 | 89.5 | -0.8 | 0 | 0 | 1 | 0 | 0 | 0 | 6 |
| 7 | 0.1 | -4.1 | -8.2 | 3.8 | 1.6 | TR | E | 0.5 | 18 | 7 | 1020.9 | 86.5 | -2.9 | 0 | 0 | 1 | 0 | 0 | 0 | 7 |
| 8 | 0.2 | -5.7 | -8.8 | 3.3 | 0.0 | 0.5 | CALM | 0.6 | 14 | 8 | 1018.8 | 96.4 | -2.4 | 0 | 0 | 1 | 0 | 0 | 0 | 8 |
| 9 | 1.8 | -2.5 | -7.5 | 3.0 | 6.0 | 0.8 | NE | 2.0 | 16 | 1 | 1023.8 | 91.8 | -0.6 | 0 | 0 | 0 | 1 | 0 | 0 | 9 |
| 10 | 2.8 | -0.6 | -5.9 | 2.8 | 0.6 | 1.1 | NW | 2.6 | 21 | 7 | 1028.3 | 97.9 | 0.8 | 0 | 0 | 1 | 1 | 0 | 0 | 10 |
| 11 | 1.5 | -4.5 | -8.5 | 2.6 | 6.9 | 0.0 | CALM | 0.3 | 9 | 0 | 1037.2 | 92.5 | -2.3 | 0 | 0 | 0 | 0 | 0 | 0 | 11 |
| 12 | 7.6 | -2.8 | -7.2 | 2.5 | 1.6 | 0.1 | SW | 5.4 | 30 | 1 | 1034.7 | 88.2 | 0.3 | 0 | 0 | 0 | 0 | 0 | 0 | 12 |
| 13 | 10.3 | 3.5 | 2.9 | 2.4 | 0.7 | 0.0 | W | 9.9 | 32 | 7 | 1028.3 | 90.5 | 7.4 | 0 | 0 | 0 | 0 | 0 | 0 | 13 |
| 14 | 9.5 | 7.6 | 5.2 | 2.5 | 0.6 | 0.0 | SW | 11.1 | 37 | 7 | 1027.2 | 82.8 | 8.2 | 0 | 0 | 0 | 0 | 0 | 0 | 14 |
| 15 | 9.6 | 7.9 | 5.7 | 3.8 | 2.7 | 0.0 | SW | 10.5 | 37 | 7 | 1020.7 | 80.8 | 7.5 | 0 | 0 | 0 | 0 | 0 | 0 | 15 |
| 16 | 9.5 | 3.7 | 1.1 | 4.0 | 6.5 | TR | SW | 7.1 | 25 | 2 | 1025.4 | 86.8 | 5.9 | 0 | 0 | 0 | 0 | 0 | 0 | 16 |
| 17 | 7.3 | 6.5 | 5.0 | 4.2 | 0.1 | 0.7 | SW | 9.4 | 35 | 7 | 1013.4 | 90.1 | 6.1 | 0 | 0 | 0 | 0 | 0 | 0 | 17 |
| 18 | 8.6 | 3.3 | 1.0 | 4.5 | 1.6 | 8.4 | S | 7.2 | 32 | 7 | 1011.5 | 91.5 | 5.0 | 0 | 0 | 0 | 0 | 0 | 0 | 18 |
| 19 | 8.8 | 4.8 | 4.0 | 4.7 | 2.4 | 3.7 | S | 7.7 | 32 | 8 | 997.4 | 95.8 | 6.0 | 0 | 0 | 0 | 0 | 0 | 0 | 19 |
| 20 | 9.2 | 5.0 | 3.0 | 5.0 | 0.0 | 4.0 | S | 9.5 | 44 | 8 | 989.7 | 96.4 | 7.3 | 0 | 0 | 0 | 0 | 0 | 0 | 20 |
| 21 | 7.9 | 6.5 | 4.0 | 5.4 | 0.0 | 15.2 | S | 4.8 | 32 | 8 | 981.5 | 94.9 | 6.6 | 0 | 0 | 0 | 0 | 0 | 0 | 21 |
| 22 | 8.4 | 4.8 | 3.7 | 5.5 | 1.2 | 0.9 | W | 5.7 | 28 | 8 | 993.0 | 92.4 | 5.7 | 0 | 0 | 0 | 0 | 0 | 0 | 22 |
| 23 | 7.1 | 4.4 | 3.5 | 5.7 | 1.9 | 0.0 | NW | 4.5 | 28 | 6 | 1025.0 | 87.1 | 4.3 | 0 | 0 | 0 | 0 | 0 | 0 | 23 |
| 24 | 9.3 | 1.9 | -3.5 | 5.0 | 5.6 | 0.2 | SW | 6.5 | 25 | 3 | 1036.2 | 88.8 | 5.1 | 0 | 0 | 0 | 0 | 0 | 0 | 24 |
| 25 | 12.3 | 7.0 | 5.0 | 5.0 | 2.1 | 2.1 | SW | 7.6 | 32 | 8 | 1029.2 | 87.8 | 7.3 | 0 | 0 | 0 | 0 | 0 | 0 | 25 |
| 26 | 12.7 | 4.5 | 0.5 | 5.2 | 0.1 | 0.2 | SW | 7.4 | 25 | 8 | 1028.7 | 92.2 | 9.1 | 0 | 0 | 0 | 0 | 0 | 0 | 26 |
| 27 | 13.4 | 8.4 | 6.1 | 6.0 | 5.3 | 0.2 | W | 9.8 | 37 | 8 | 1026.3 | 92.0 | 9.3 | 0 | 0 | 0 | 0 | 0 | 0 | 27 |
| 28 | 7.9 | 4.4 | 1.4 | 6.3 | 3.3 | 1.3 | W | 12.0 | 46 | 0 | 1014.7 | 79.9 | 4.8 | 0 | 0 | 0 | 0 | 1 | 0 | 28 |
| 29 | 4.5 | 3.2 | 0.2 | 5.5 | 0.0 | 1.4 | NW | 10.4 | 41 | 8 | 1011.1 | 78.2 | 3.1 | 0 | 0 | 0 | 0 | 0 | 0 | 29 |
| 30 | 1.0 | -0.2 | -3.4 | 4.9 | 1.4 | 15.2 | N | 6.5 | 48 | 3 | 1011.1 | 89.0 | -0.5 | 0 | 0 | 1 | 0 | 0 | 0 | 30 |
| 31 | 2.0 | -4.8 | -5.4 | 4.2 | 3.0 | 6.4 | W | 2.6 | 16 | 1 | 1022.5 | 93.8 | -2.2 | 0 | 0 | 0 | 1 | 0 | 0 | 31 |
| Total/Mean | 6.6 | 2.3 | -0.4 | 4.7 | 67.5 | 98.0 | X | 5.7 | X | 5.6 | 1015.6 | 90.7 | 3.7 | 0 | 0 | 6 | 3 | 2 | 0 | Total/Mean |
| *Diff./% | 0.0 | +0.2 | 125% | 191% | *Diff./% |
Additional Data:
Rainfall Duration 90.5 hours
Air Frost Duration 186.3 hours
Differences from average:
Differences from average shown in red. Reference periods used are as follows: Temperature 30 Years 1973/2002; rainfall 30 Years 1971/2000; sunshine 30 Years 1961/1990.
*The differences from average quoted during the course of the month relate to the cumulative daily averages up to the date of the last observation, not the averages for the month as a whole.
Observations practice:
Note: In line with standard meteorological practice the 24 hour maximum temperature and rainfall are read at 0900 GMT and credited to the previous day i.e. data shown above for 1st actually read at 0900 GMT on 2nd and represents the previous 24 hours. The 24 hour minimum and grass minimum temperatures are similarly observed at 0900 GMT but are credited to the day of the reading (e.g. observations made at 0900 GMT on 2nd shown against 2nd and represent previous 24 hours). This is the reason why at daily update of the above table the minimum a grass minimum temperatures appear to be "ahead" of the other data mentioned. (This explanation given in response to a query received).
Graphs and Charts:
Click on the following links to view this month's graphs and charts.....
1. Daily Maximum, Minimum & Grass Minimum Temperatures
2. Daily Maximum & Minimum Temperatures (with 25 Year Comparative Means)
3. Daily Earth (30 cms Depth) Temperature @ 0900 GMT 4. Daily Rainfall 5. Daily Sunshine
6. Daily Maximum Gust & Mean Wind Speed 7. Daily Wind Direction @ 0900 GMT
8. Daily Mean MSL Air Pressure 9. Daily Mean Relative Humidity 10. Thermograph
11 . Barograph 12. Hygrograph 13. Anemograph 14. Wind Direction
15. Sunshine Duration 16. Rainfall Intensity & Duration
January 2003 Weather Review:
......and click on the link below for a text report of the January 2003 weather in Royston
31st January 2003 snow picture supplement (24 photographs) - click here
January (since 1973) at Royston (Iceni) Weather Station:
Mean day maximum temperature (30 years 1973/2002) 6.6°C
Mean night minimum temperature (30 years 1973/2002) 2.1°C
Highest temperature 14.2°C (6th January 1999); lowest temperature -12.7°C (14th January 1982)
Lowest grass minimum temperature -18.1°C (10th January 1982)
Warmest January 1983, 1990 (Mean temperature 6.9°C); coldest January 1979 (Mean temperature 0.1°C)
Average January rainfall (30 years 1971/2000) 51.2 mm
Wettest January 1995 (Rainfall 108.2 mm); driest January 1987 (Rainfall 9.6 mm)
Wettest Day 9th January 1992 (Rainfall 25.1 mm);
Highest number of "rain days" (0.2 mm or more) 25 (1988); lowest number of "rain days" 9 (1992)
Highest number of days with thunder 1 (1974, 1984. 1988, 1994 and 1998)
Highest number of air frosts 20 (1979, 1985)
Highest number of ground frosts 25 (1979)
Highest number of days with snow falling 15 (1985)
Highest number of days with snow lying (ground with more than 50% snow cover @ 0900 GMT) 17 (1985)
|
|
|
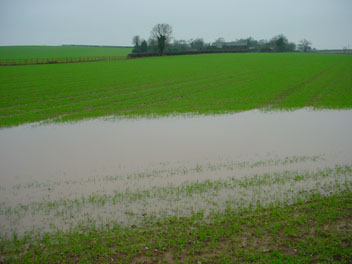
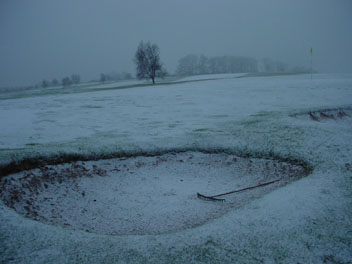
| Surface water on the landscape is a most unusual sight in the area around Royston due to the very well drained chalk on which the district lies. Here the soil in this field of Autumn sown cereals close to Heath Farm some 2 km SE of Royston (as seen at 0944 GMT on 3rd January 2003) has probably become a little compacted and has been unable to cope with the 60 millimetres rainfall which has fallen in the preceding 6 days, including the wettest New Year's Day in at least the last 30 years. The scene appears dull, this being the 6th consecutive day without sunshine. The temperature is 3.7°C, with a NNE wind, mean speed 2 knots, gusting to 10 knots. | A snow shower around noon on 8th January 2003 has given a light covering of snow in the Royston district. and this is the scene on a deserted golf course on Therfield Heath at 1522 GMT. The minimum temperature of -5.7°C the preceding night was the lowest temperature recorded in any month for 6 years. At the time of the photograph the temperature was -0.3°C, in calm conditions with only the occasional gust of 4 knots from the NE. Although milder conditions did not arrive until 12th this light snow cover only lasted for 2 days. The weather then remained mild until near the end of the month when temperatures dropped and a heavy snowfall occurred on 30th. | It may have been cold outside in the strong north-westerly winds on 28th January 2003 but in warmer conditions under glass at the University Botanic Garden in Cambridge (21 km NE of Royston) a splendid display of orchids brightens the winter gloom. A mainly sunny morning gave way at about 1300 GMT to a sudden squally shower of heavy snow and hail which moved in from the north and swept across Cambridge and on to Royston. At Royston the temperature fell from 7.3°C to 2.5°C between 1315 and 1345 GMT and wind gusts up to 44 mph were recorded in this period. Total sunshine of 3.3 hours was logged for the day. |
Click here for 31st January 2003 snow picture supplement
Return to Welcome to Royston (Iceni) Weather Station page
(This page last updated 1st February 2003 2157 GMT)