Royston (Iceni) Weather Station
Daily Weather Observations - October 2002
| Date | Max | Min | Grass | Earth | Sunshine | Rainfall | Wind | Mean | Max | Cloud | Mean | Mean | Mean | Fog | Fog | Snow | Snow | Hail | Thunder | Date |
| Temp | Temp | Min | (30cm) | (Hrs) | (MM) | Direc- | Wind | Gust | Cover | MSL | Rel. | Temp | (vis.< | (vis.< | or | Lying | 00/00h | 00/00h | ||
| (°C) | (°C) | Temp | Temp | 00/00h | 09/09h | tion | Speed | Speed | (Oktas) | Pressure | Humd | (°C) | 1000m) | 200m | Rain/ | (>50% | ||||
| 09/09h | 09/09h | (°C) | (°C) | 09h | (mph) | (mph) | 09h | (mb) | (%) | 00/00h | 09h | 09h | Snow | cover | ||||||
| 09/09h | 09h | 00/00h | 00/00h | 00/00h | 00/00h | 00/00h | 09h) | |||||||||||||
| 1 | 21.5 | 11.1 | 7.0 | 14.4 | 5.1 | TR | SE | 1.6 | 14 | 4 | 1021.4 | 74.6 | 16.0 | 0 | 0 | 0 | 0 | 0 | 0 | 1 |
| 2 | 19.5 | 13.6 | 11.9 | 14.9 | 0.9 | 1.2 | SE | 2.6 | 16 | 7 | 1019.2 | 85.0 | 15.7 | 0 | 0 | 0 | 0 | 0 | 0 | 2 |
| 3 | 19.6 | 13.5 | 12.0 | 15.2 | 7.6 | 0.0 | NW | 2.2 | 18 | 4 | 1023.3 | 78.4 | 14.8 | 0 | 0 | 0 | 0 | 0 | 0 | 3 |
| 4 | 16.7 | 9.0 | 5.0 | 14.8 | 8.9 | 0.0 | W | 1.8 | 16 | 1 | 1028.7 | 74.3 | 12.0 | 0 | 0 | 0 | 0 | 0 | 0 | 4 |
| 5 | 17.7 | 10.5 | 6.5 | 14.5 | 2.8 | 0.3 | W | 6.1 | 25 | 4 | 1024.7 | 81.7 | 14.1 | 0 | 0 | 0 | 0 | 0 | 0 | 5 |
| 6 | 17.8 | 10.9 | 8.0 | 14.5 | 4.6 | 0.0 | N | 1.9 | 21 | 5 | 1021.8 | 81.3 | 12.4 | 0 | 0 | 0 | 0 | 0 | 0 | 6 |
| 7 | 16.8 | 7.1 | 3.3 | 14.1 | 2.3 | 0.0 | CALM | 0.1 | 9 | 8 | 1019.5 | 73.7 | 11.6 | 0 | 0 | 0 | 0 | 0 | 0 | 7 |
| 8 | 14.5 | 9.6 | 8.1 | 14.1 | 1.0 | 0.0 | SE | 1.0 | 23 | 8 | 1012.4 | 79.3 | 11.1 | 0 | 0 | 0 | 0 | 0 | 0 | 8 |
| 9 | 14.9 | 6.1 | 3.1 | 13.5 | 8.3 | 0.0 | NE | 1.4 | 21 | 1 | 1007.8 | 84.6 | 9.4 | 0 | 0 | 0 | 0 | 0 | 0 | 9 |
| 10 | 15.5 | 6.7 | 4.4 | 13.0 | 1.7 | 0.0 | NE | 2.2 | 18 | 8 | 1010.7 | 83.4 | 11.0 | 0 | 0 | 0 | 0 | 0 | 0 | 10 |
| 11 | 12.1 | 7.6 | 5.2 | 13.0 | 0.0 | 6.5 | NE | 0.7 | 14 | 8 | 1013.4 | 83.5 | 9.6 | 0 | 0 | 0 | 0 | 0 | 0 | 11 |
| 12 | 12.1 | 8.2 | 7.4 | 12.9 | 0.7 | 0.5 | CALM | 1.0 | 18 | 8 | 1011.4 | 92.0 | 8.6 | 0 | 0 | 0 | 0 | 0 | 0 | 12 |
| 13 | 11.0 | 4.9 | 1.3 | 12.0 | 0.0 | 11.3 | CALM | 0.9 | 32 | 8 | 1007.4 | 92.5 | 8.0 | 0 | 0 | 0 | 0 | 0 | 0 | 13 |
| 14 | 11.8 | 9.6 | 9.4 | 11.9 | 0.3 | 4.2 | NW | 1.4 | 18 | 8 | 1005.3 | 96.5 | 9.4 | 0 | 0 | 0 | 0 | 0 | 0 | 14 |
| 15 | 13.0 | 6.8 | 4.4 | 11.8 | 0.0 | 21.4 | NE | 3.7 | 41 | 8 | 1000.1 | 98.4 | 9.3 | 0 | 0 | 0 | 0 | 0 | 0 | 15 |
| 16 | 10.7 | 8.1 | 7.9 | 11.8 | 0.1 | 0.1 | NW | 3.4 | 30 | 8 | 999.9 | 91.4 | 7.8 | 0 | 0 | 0 | 0 | 0 | 0 | 16 |
| 17 | 11.6 | 2.9 | -0.3 | 11.0 | 8.5 | 0.0 | NW | 2.2 | 21 | 0 | 1004.8 | 84.7 | 6.2 | 0 | 0 | 0 | 0 | 0 | 0 | 17 |
| 18 | 10.5 | 3.6 | 1.2 | 10.4 | 4.6 | 0.0 | W | 1.4 | 16 | 8 | 1009.8 | 86.5 | 5.3 | 0 | 0 | 0 | 0 | 0 | 0 | 18 |
| 19 | 11.2 | 1.1 | -1.9 | 9.8 | 8.0 | 0.0 | W | 2.4 | 23 | 0 | 1019.5 | 78.9 | 5.3 | 0 | 0 | 0 | 0 | 0 | 0 | 19 |
| 20 | 10.8 | 2.5 | -1.0 | 9.0 | 0.0 | 6.5 | CALM | 0.8 | 23 | 8 | 1013.7 | 87.8 | 5.8 | 0 | 0 | 0 | 0 | 0 | 0 | 20 |
| 21 | 15.8 | 7.8 | 6.5 | 9.3 | 1.1 | 2.9 | SE | 3.4 | 21 | 8 | 994.3 | 96.0 | 11.3 | 0 | 0 | 0 | 0 | 0 | 0 | 21 |
| 22 | 16.1 | 11.5 | 9.6 | 10.4 | 1.4 | 0.6 | S | 4.8 | 28 | 8 | 982.7 | 95.1 | 13.1 | 0 | 0 | 0 | 0 | 0 | 0 | 22 |
| 23 | 11.0 | 6.8 | 5.0 | 11.0 | 5.6 | 0.5 | W | 7.8 | 35 | 1 | 999.2 | 75.5 | 7.3 | 0 | 0 | 0 | 0 | 0 | 0 | 23 |
| 24 | 13.5 | 2.5 | 0.5 | 9.9 | 7.1 | 0.1 | S | 3.1 | 23 | 1 | 1006.2 | 82.9 | 7.1 | 0 | 0 | 0 | 0 | 0 | 0 | 24 |
| 25 | 15.6 | 8.9 | 6.5 | 9.6 | 3.7 | 0.3 | SW | 10.5 | 48 | 6 | 991.9 | 84.4 | 11.7 | 0 | 0 | 0 | 0 | 0 | 0 | 25 |
| 26 | 15.1 | 8.9 | 6.6 | 10.0 | 4.7 | 3.1 | W | 9.9 | 44 | 7 | 1007.9 | 73.6 | 9.9 | 0 | 0 | 0 | 0 | 0 | 0 | 26 |
| 27 | 12.7 | 8.6 | 8.0 | 10.1 | 2.0 | TR | W | 16.9 | 71 | 6 | 1004.0 | 75.0 | 10.8 | 0 | 0 | 0 | 0 | 0 | 0 | 27 |
| 28 | 12.3 | 6.1 | 4.0 | 9.8 | 5.5 | 0.0 | W | 5.4 | 25 | 1 | 1027.9 | 76.9 | 8.1 | 0 | 0 | 0 | 0 | 0 | 0 | 28 |
| 29 | 12.9 | 7.5 | 5.5 | 9.5 | 0.0 | 2.7 | SE | 2.0 | 25 | 8 | 1015.6 | 86.5 | 9.9 | 0 | 0 | 0 | 0 | 0 | 0 | 29 |
| 30 | 10.0 | 7.2 | 7.0 | 10.0 | 0.0 | 3.3 | CALM | 0.1 | 9 | 8 | 1015.8 | 98.6 | 8.4 | 0 | 0 | 0 | 0 | 0 | 0 | 30 |
| 31 | 12.7 | 8.9 | 8.6 | 10.3 | 2.0 | TR | CALM | 0.7 | 16 | 8 | 1019.2 | 93.1 | 9.9 | 0 | 0 | 0 | 0 | 0 | 0 | 31 |
| Mean/Total | 14.1 | 7.7 | 5.5 | 11.8 | 98.0 | 65.5 | X | 3.3 | X | 5.7 | 1011.0 | 84.7 | 10.0 | 0 | 0 | 0 | 0 | 0 | 0 | Mean/Total |
| (-0.2) | (+0.1) | (90%) | (115%) |
(*All times GMT*)
Additional Data:
Rainfall Duration 62.3 hours
Air Frost Duration NIL hours
Differences from average:
Differences from average shown in red. Reference periods used are as follows: Temperature 25 Years 1973/1997; rainfall 30 Years 1971/2000; sunshine 30 Years 1961/1990.
Observations practice:
Note: In line with standard meteorological practice the 24 hour maximum temperature and rainfall are read at 0900 GMT and credited to the previous day i.e. data shown above for 1st actually read at 0900 GMT on 2nd and represents the previous 24 hours. The 24 hour minimum and grass minimum temperatures are similarly observed at 0900 GMT but are credited to the day of the reading (e.g. observations made at 0900 GMT on 2nd shown against 2nd and represent previous 24 hours). This is the reason why at daily update of the above table the minimum and grass minimum temperatures appear to be "ahead" of the other data mentioned. (This explanation given in response to a query received).
Graphs and Charts:
Click on the following links to view this month's graphs and charts.....
1. Daily Maximum, Minimum & Grass Minimum Temperatures
2. Daily Maximum & Minimum Temperatures (with 25 Year Comparative Means)
3. Daily Earth (30 cms Depth) Temperature @ 0900 GMT 4. Daily Rainfall 5. Daily Sunshine
6. Daily Maximum Gust & Mean Wind Speed 7. Daily Wind Direction @ 0900 GMT
8. Daily Mean MSL Air Pressure 9. Daily Mean Relative Humidity 10. Thermograph
11 . Barograph 12. Hygrograph 13. Anemograph 14. Wind Direction
15. Sunshine Duration 16. Rainfall Intensity & Duration
October 2002 Weather Review:
......and click on the link below for a text report of the October 2002 weather in Royston
October (since 1972) at Royston (Iceni) Weather Station:
Mean day maximum temperature (25 years 1973/1997) 14.3°C
Mean night minimum temperature (25 years 1973/1997) 7.6°C
Highest temperature 27.5°C (1st October 1985); lowest temperature -3.6°C (29th October 1997)
Lowest grass minimum temperature -8.3°C (29th October 1997)
Warmest October 2001 (Mean temperature 14.3°C); coldest October 1974 (Mean temperature 7.3°C)
Highest no. of days with air frost 5 (1997); highest no. of days with ground frost 11 (1997)
Average October rainfall (30 years 1971/2000) 57.0 mm
Wettest October 2001 (Rainfall 137.8 mm); driest October 1972 (Rainfall 4.1 mm)
Wettest Day 20th October 2001 (Rainfall 51.8 mm);
Highest number of "rain days" (0.2 mm or more) 23 (2000); lowest number of "rain days" 3 (1972)
Highest number of days with thunder 3 (1984)
|
|
|
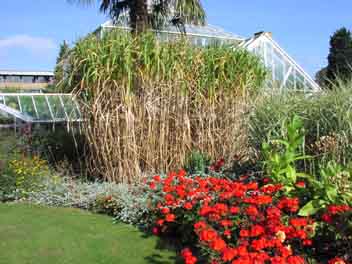
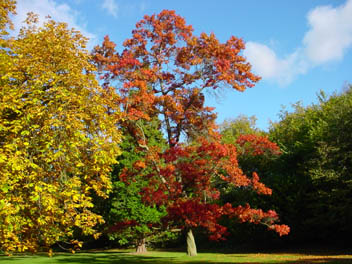
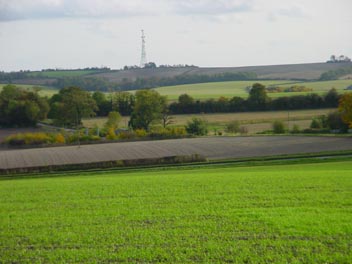
| Despite being almost half way through Autumn these geraniums (with an impressive bamboo backdrop) are still in full bloom in the University Botanic Garden, Cambridge on 9th October 2002. The weather data for Royston (some 21 km to the SW) often shows a close correlation with the observations taken at the weather station maintained at this site. Bright sunshine persisted for much of the day, totalling 8.3 hours at Royston. The day started off on a rather cool note with an overnight minimum temperature of 6.1°C at Royston, but the temperature later rose to a maximum of 14.9°C for the day. | This spectacular Scarlet Oak (Quercus coccinea), a native of North America, stands out amongst the many Autumn colours to be found at Anglesey Abbey, a National Trust property some 28 km NE of Royston. Bright sunshine is illuminating the scene when this photograph was taken at 1040 GMT on 23rd October 2002. Sunny periods continued for much of the day, and at Royston 5.6 hours sunshine was recorded. The air was fairly cool, however, and despite the sunshine the temperature achieved a maximum of only 11.0°C (2.1°C below the 25 Year average for this day) at Royston . | The calm before the storm! This is the scene as viewed at 1429 GMT on 26th October 2002 from a point on the Burloes estate about 1 km SE of Royston looking southwards towards the crest of the East Anglian Heights, some 3 km distant. High cloud ahead of a rapidly deepening low pressure system has turned the sunshine hazy, and very stormy conditions over the country followed the next day, with a maximum wind gust speed at Royston of 71 mph at both 0915 and 1035 GMT. Many branches were blown off trees in Royston, and much damage and disruption occurred nationwide. |
Return to Welcome to Royston (Iceni) Weather Station page
(This page last updated 8th November 2002 2052 GMT)