Royston (Iceni) Weather Station
Daily Weather Observations - August 2002
| Date | Max | Min | Grass | Earth | Sunshine | Rainfall | Wind | Mean | Max | Cloud | Mean | Mean | Mean | Fog | Fog | Snow | Snow | Hail | Thunder | Date |
| Temp | Temp | Min | (30cm) | (Hrs) | (MM) | Direc- | Wind | Gust | Cover | MSL | Rel. | Temp | (vis.< | (vis.< | or | Lying | 00/00h | 00/00h | ||
| (°C) | (°C) | Temp | Temp | 00/00h | 09/09h | tion | Speed | Speed | (Oktas) | Pressure | Humd | (°C) | 1000m) | 200m | Rain/ | (>50% | ||||
| 09/09h | 09/09h | (°C) | (°C) | 09h | (mph) | (mph) | 09h | (mb) | (%) | 00/00h | 09h | 09h | Snow | cover | ||||||
| 09/09h | 09h | 00/00h | 00/00h | 00/00h | 00/00h | 00/00h | 09h) | |||||||||||||
| 1 | 20.2 | 13.9 | 13.4 | 19.9 | 0.2 | 0.3 | CALM | 0.6 | 12 | 8 | 1011.7 | 82.5 | 15.7 | 0 | 0 | 0 | 0 | 0 | 0 | 1 |
| 2 | 23.2 | 12.3 | 9.5 | 19.1 | 9.4 | 0.5 | S | 1.9 | 16 | 1 | 1010.7 | 71.6 | 18.0 | 0 | 0 | 0 | 0 | 0 | 0 | 2 |
| 3 | 19.8 | 13.6 | 11.3 | 19.5 | 0.5 | 7.9 | CALM | 0.1 | 16 | 8 | 1011.5 | 87.9 | 15.9 | 0 | 0 | 0 | 0 | 0 | 0 | 3 |
| 4 | 21.1 | 12.6 | 10.7 | 19.0 | 3.7 | 1.7 | N | 0.5 | 14 | 7 | 1012.1 | 86.8 | 15.5 | 0 | 0 | 0 | 0 | 0 | 1 | 4 |
| 5 | 20.5 | 11.9 | 10.0 | 19.0 | 1.7 | 8.6 | N | 0.5 | 16 | 8 | 1014.4 | 92.1 | 16.0 | 0 | 0 | 0 | 0 | 0 | 0 | 5 |
| 6 | 22.7 | 13.9 | 11.7 | 19.0 | 1.5 | 0.0 | N | 1.5 | 21 | 7 | 1016.7 | 86.5 | 17.5 | 0 | 0 | 0 | 0 | 0 | 0 | 6 |
| 7 | 24.5 | 14.1 | 11.4 | 19.0 | 2.8 | 17.4 | CALM | 0.7 | 16 | 5 | 1016.7 | 84.1 | 18.8 | 0 | 0 | 0 | 0 | 0 | 1 | 7 |
| 8 | 19.5 | 15.0 | 13.5 | 19.6 | 0.6 | 6.0 | NW | 0.7 | 14 | 8 | 1010.4 | 88.7 | 16.3 | 0 | 0 | 0 | 0 | 0 | 0 | 8 |
| 9 | 17.1 | 13.0 | 12.9 | 19.1 | 0.7 | 4.2 | CALM | 0.5 | 12 | 8 | 1002.9 | 94.0 | 14.8 | 0 | 0 | 0 | 0 | 0 | 0 | 9 |
| 10 | 21.0 | 13.6 | 13.1 | 18.7 | 5.3 | 0.9 | N | 0.6 | 14 | 8 | 1005.3 | 87.0 | 16.8 | 0 | 0 | 0 | 0 | 0 | 0 | 10 |
| 11 | 21.5 | 14.9 | 12.4 | 18.8 | 1.8 | 0.0 | W | 3.3 | 23 | 6 | 1006.5 | 81.5 | 17.1 | 0 | 0 | 0 | 0 | 0 | 0 | 11 |
| 12 | 21.5 | 14.6 | 12.8 | 19.1 | 4.5 | 0.0 | NW | 3.6 | 23 | 8 | 1013.7 | 73.9 | 17.0 | 0 | 0 | 0 | 0 | 0 | 0 | 12 |
| 13 | 25.0 | 13.5 | 11.0 | 18.6 | 5.5 | 0.0 | W | 3.6 | 23 | 1 | 1019.8 | 72.0 | 19.4 | 0 | 0 | 0 | 0 | 0 | 0 | 13 |
| 14 | 26.8 | 16.6 | 14.2 | 19.4 | 12.0 | 0.0 | SW | 2.0 | 21 | 5 | 1018.9 | 71.2 | 21.0 | 0 | 0 | 0 | 0 | 0 | 0 | 14 |
| 15 | 29.0 | 16.8 | 14.0 | 19.8 | 9.1 | TR | SW | 2.7 | 21 | 4 | 1015.8 | 69.6 | 22.1 | 0 | 0 | 0 | 0 | 0 | 0 | 15 |
| 16 | 26.3 | 13.5 | 11.9 | 20.4 | 9.9 | 0.0 | NE | 1.0 | 14 | 1 | 1018.0 | 74.2 | 19.9 | 0 | 0 | 0 | 0 | 0 | 0 | 16 |
| 17 | 30.0 | 15.8 | 15.0 | 20.6 | 11.5 | 0.0 | SE | 3.1 | 28 | 0 | 1013.1 | 71.0 | 22.6 | 0 | 0 | 0 | 0 | 0 | 0 | 17 |
| 18 | 26.5 | 17.1 | 15.1 | 20.9 | 3.9 | 0.1 | SE | 0.6 | 14 | 7 | 1010.4 | 70.5 | 21.3 | 0 | 0 | 0 | 0 | 0 | 0 | 18 |
| 19 | 25.0 | 17.2 | 15.5 | 21.0 | 4.7 | 1.6 | CALM | 1.2 | 16 | 8 | 1010.3 | 82.2 | 19.9 | 0 | 0 | 0 | 0 | 0 | 0 | 19 |
| 20 | 19.2 | 16.6 | 16.6 | 20.9 | 0.1 | TR | W | 0.8 | 14 | 8 | 1014.6 | 92.6 | 17.3 | 0 | 0 | 0 | 0 | 0 | 0 | 20 |
| 21 | 22.6 | 11.0 | 8.9 | 19.9 | 9.8 | 0.0 | NW | 1.5 | 18 | 1 | 1018.9 | 74.4 | 16.6 | 0 | 0 | 0 | 0 | 0 | 0 | 21 |
| 22 | 22.5 | 12.2 | 10.0 | 19.8 | 4.6 | 0.1 | CALM | 0.5 | 12 | 4 | 1019.6 | 73.5 | 16.6 | 0 | 0 | 0 | 0 | 0 | 0 | 22 |
| 23 | 22.2 | 14.2 | 12.6 | 19.5 | 3.8 | 0.0 | W | 1.1 | 14 | 6 | 1019.3 | 71.5 | 17.6 | 0 | 0 | 0 | 0 | 0 | 0 | 23 |
| 24 | 23.9 | 12.0 | 9.3 | 19.5 | 7.7 | 0.0 | NW | 0.6 | 16 | 3 | 1021.3 | 76.7 | 17.0 | 0 | 0 | 0 | 0 | 0 | 0 | 24 |
| 25 | 21.5 | 12.9 | 10.1 | 19.4 | 1.9 | 0.0 | N | 1.4 | 21 | 8 | 1025.5 | 84.9 | 15.6 | 0 | 0 | 0 | 0 | 0 | 0 | 25 |
| 26 | 16.3 | 11.0 | 9.9 | 18.9 | 0.0 | TR | N | 1.6 | 21 | 8 | 1024.3 | 91.7 | 13.6 | 0 | 0 | 0 | 0 | 0 | 0 | 26 |
| 27 | 19.3 | 13.4 | 13.1 | 18.1 | 1.4 | 0.0 | N | 1.4 | 18 | 8 | 1021.0 | 89.0 | 15.3 | 0 | 0 | 0 | 0 | 0 | 0 | 27 |
| 28 | 24.0 | 12.0 | 9.0 | 17.9 | 8.3 | 0.0 | NW | 0.7 | 12 | 7 | 1020.4 | 81.6 | 17.2 | 0 | 0 | 0 | 0 | 0 | 0 | 28 |
| 29 | 24.6 | 14.8 | 12.2 | 18.6 | 5.6 | TR | W | 3.2 | 15 | 4 | 1018.4 | 79.7 | 19.5 | 0 | 0 | 0 | 0 | 0 | 0 | 29 |
| 30 | 23.0 | 15.5 | 12.9 | 18.9 | 3.4 | 0.3 | SW | 5.7 | 28 | 5 | 1016.1 | 84.0 | 18.8 | 0 | 0 | 0 | 0 | 0 | 0 | 30 |
| 31 | 20.0 | 11.9 | 9.8 | 18.6 | 5.6 | 0.0 | NW | 3.3 | 23 | 1 | 1024.2 | 68.6 | 15.1 | 0 | 0 | 0 | 0 | 0 | 0 | 31 |
| Mean/Total | 22.6 | 13.9 | 12.1 | 19.4 | 141.1 | 49.6 | X | 1.6 | X | 5.5 | 1015.6 | 80.5 | 17.6 | 0 | 0 | 0 | 0 | 0 | 2 | Mean/Total |
| (+0.4) | (+1.5) | (80%) | (100%) |
(*All times GMT*)
Additional Data:
Rainfall Duration 35.6 hours
Air Frost Duration NIL hours
Differences from average:
Differences from average shown in red. Reference periods used are as follows: Temperature 25 Years 1973/1997; rainfall 30 Years 1971/2000; sunshine 30 Years 1961/1990.
Observations practice:
Note: In line with standard meteorological practice the 24 hour maximum temperature and rainfall are read at 0900 GMT and credited to the previous day i.e. data shown above for 1st actually read at 0900 GMT on 2nd and represents the previous 24 hours. The 24 hour minimum and grass minimum temperatures are similarly observed at 0900 GMT but are credited to the day of the reading (e.g. observations made at 0900 GMT on 2nd shown against 2nd and represent previous 24 hours). This is the reason why at daily update of the above table the minimum and grass minimum temperatures appear to be "ahead" of the other data mentioned. (This explanation given in response to a query received).
Graphs and Charts:
Click on the following links to view this month's graphs and charts.....
1. Daily Maximum, Minimum & Grass Minimum Temperatures
2. Daily Maximum & Minimum Temperatures (with 25 Year Comparative Means)
3. Daily Earth (30 cms Depth) Temperature @ 0900 GMT 4. Daily Rainfall 5. Daily Sunshine
6. Daily Maximum Gust & Mean Wind Speed 7. Daily Wind Direction @ 0900 GMT
8. Daily Mean MSL Air Pressure 9. Daily Mean Relative Humidity 10. Thermograph
11 . Barograph 12. Hygrograph 13. Anemograph 14. Wind Direction
15. Sunshine Duration 16. Rainfall Intensity & Duration
.......and click on the link below for a text report of the August 2002 weather in Royston
August (since 1972) at Royston (Iceni) Weather Station:
Mean day maximum temperature (25 years 1973/1997) 22.2°C
Mean night minimum temperature (25 years 1973/1997) 12.4°C
Highest temperature 35.0°C (3rd August 1990); lowest temperature 5.1°C (23rd August1993)
Lowest grass minimum temperature 1.0°C (23rd August1993)
Hottest August 1997 (Mean temperature 20.9°C); coolest August 1986 (Mean temperature 14.9°C)
Average August rainfall (30 years 1971/2000) 49.6 mm
Wettest August 1974 (Rainfall 109.0 mm); driest August 1995 (Rainfall 12.1 mm)
Wettest Day 31st August 1988 (Rainfall 45.3 mm);
Highest number of "rain days" (0.2 mm or more) 16 (1974, 1985 & 1992); lowest number of "rain days" 4 (1995)
Highest number of days with thunder 6 (1999)
|
|
|
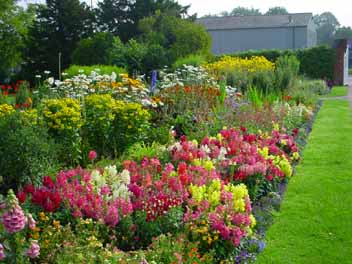
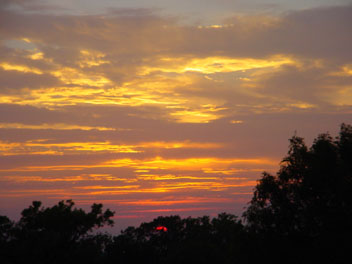
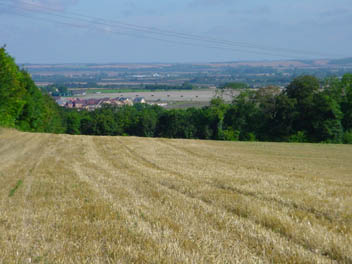
| Summer flowers are in profusion in this view as seen in Priory Gardens, Royston on 7th August 2002 at 0834 GMT. In the background can be seen the rear of the Priory Cinema, which closed several years ago, and which is currently in the course of demolition. This building replaced the original cinema which was destroyed by fire on 12th June 1933. The picture was taken in calm conditions and a temperature of 19°C (day maximum 24.5°C). The bright sunshine did not last, only 2.8 hours being recorded for the day. A spectacular evening thunderstorm produced 17.4 millimetres rainfall. | This sunset was observed from Royston on 17th August 2002 at 1914 GMT. As with most sunsets the colours can change rapidly, but here the photograph appears to have captured the golden tinges at just the right moment for maximum effect. The air is calm and the temperature is still as high as 24.4°C after a day maximum of 30.0°C. Sunshine for August was well below average at this point in the month but the total of 11.5 hours sunshine was the second highest daily value to date in the month and will help to reduce the deficit. The 17th was the hottest day of August so far. | This field of barley on the Burloes Estate had recently been harvested when this picture was taken at 0834 GMT on 21st August 2002. The view from just beyond the eastern boundary of Royston is looking northwards over the South Cambridgeshire Plain in the distance. The housing discernible in the middle distance is the new development to the north of the town adjacent to the A505 Royston by-pass. After an overnight minimum temperature of 11.0°C the temperature has risen to 16.8°C (and later reached a day maximum of 22.6°C). Sunshine for the day was 9.8 hours. |
Return to Welcome to Royston (Iceni) Weather Station page
(This page last updated 13th September 2002 1938 GMT)