Royston (Iceni) Weather Station
Daily Weather Observations - February 2002
| Date | Max | Min | Grass | Earth | Sunshine | Rainfall | Wind | Mean | Max | Cloud | Mean | Mean | Mean | Fog | Fog | Snow | Snow | Hail | Thunder | Date |
| Temp | Temp | Min | (30cm) | (Hrs) | (MM) | Direc- | Wind | Gust | Cover | MSL | Rel. | Temp | (vis.< | (vis.< | or | Lying | 00/00h | 00/00h | ||
| (°C) | (°C) | Temp | Temp | 00/00h | 09/09h | tion | Speed | Speed | (Oktas) | Pressure | Humd | (°C) | 1000m) | 200m | Rain/ | (>50% | ||||
| 09/09h | 09/09h | (°C) | (°C) | 09h | (mph) | (mph) | 09h | (mb) | (%) | 00/00h | 09h | 09h | Snow | cover | ||||||
| 09/09h | 09h | 00/00h | 00/00h | 00/00h | 00/00h | 00/00h | 09h) | |||||||||||||
| 1 | 13.2 | 6.1 | 4.4 | 7.1 | 0.00 | 0.1 | S | 15.5 | 55 | 8 | 1007.2 | 87.6 | 10.4 | 0 | 0 | 0 | 0 | 0 | 0 | 1 |
| 2 | 13.1 | 12.2 | 11.2 | 7.9 | 0.60 | 0.5 | SW | 14.6 | 53 | 8 | 1009.3 | 81.7 | 11.7 | 0 | 0 | 0 | 0 | 0 | 0 | 2 |
| 3 | 11.1 | 7.8 | 5.9 | 8.2 | 0.00 | 9.6 | S | 6.6 | 35 | 8 | 1005.0 | 88.0 | 7.9 | 0 | 0 | 0 | 0 | 0 | 0 | 3 |
| 4 | 12.5 | 3.6 | 2.0 | 7.6 | 0.00 | 4.7 | S | 12.2 | 51 | 8 | 1005.2 | 94.6 | 7.1 | 0 | 0 | 0 | 0 | 0 | 0 | 4 |
| 5 | 12.2 | 9.9 | 8.5 | 7.6 | 4.69 | 2.8 | SW | 10.5 | 39 | 7 | 994.3 | 85.6 | 8.7 | 0 | 0 | 0 | 0 | 0 | 0 | 5 |
| 6 | 8.1 | 4.9 | 2.6 | 7.3 | 2.30 | TR | W | 9.3 | 37 | 7 | 1004.5 | 79.3 | 5.5 | 0 | 0 | 0 | 0 | 0 | 0 | 6 |
| 7 | 11.0 | 2.1 | -1.0 | 6.5 | 0.00 | 1.8 | S | 9.4 | 44 | 8 | 1015.9 | 90.5 | 5.5 | 0 | 0 | 0 | 0 | 0 | 0 | 7 |
| 8 | 12.9 | 9.0 | 7.3 | 6.5 | 0.00 | 0.4 | S | 9.9 | 35 | 8 | 1014.0 | 91.7 | 10.2 | 0 | 0 | 0 | 0 | 0 | 0 | 8 |
| 9 | 10.6 | 9.6 | 8.2 | 7.4 | 2.23 | 0.0 | SW | 14.0 | 44 | 7 | 1003.5 | 76.4 | 9.2 | 0 | 0 | 0 | 0 | 0 | 0 | 9 |
| 10 | 13.0 | 5.7 | 3.3 | 7.0 | 4.13 | 0.1 | W | 12.3 | 39 | 1 | 1006.1 | 80.1 | 8.2 | 0 | 0 | 0 | 0 | 0 | 0 | 10 |
| 11 | 13.3 | 10.5 | 9.7 | 7.5 | 0.00 | 1.9 | SW | 14.5 | 44 | 8 | 1000.3 | 88.4 | 11.7 | 0 | 0 | 0 | 0 | 0 | 0 | 11 |
| 12 | 12.4 | 9.0 | 6.9 | 8.0 | 3.31 | 0.0 | SW | 10.8 | 37 | 1 | 1009.4 | 81.0 | 9.9 | 0 | 0 | 0 | 0 | 0 | 0 | 12 |
| 13 | 11.0 | 5.5 | 1.8 | 8.0 | 3.47 | 2.4 | W | 4.2 | 30 | 6 | 1019.0 | 87.9 | 6.3 | 0 | 0 | 0 | 0 | 0 | 0 | 13 |
| 14 | 8.7 | 0.6 | -2.6 | 7.3 | 7.47 | 0.0 | N | 2.7 | 21 | 6 | 1031.5 | 81.2 | 2.4 | 0 | 0 | 0 | 0 | 0 | 0 | 14 |
| 15 | 8.6 | -2.5 | -6.9 | 6.0 | 8.37 | 0.0 | CALM | 0.6 | 14 | 0 | 1035.5 | 88.5 | 2.2 | 0 | 0 | 0 | 0 | 0 | 0 | 15 |
| 16 | 8.5 | -0.6 | -3.9 | 5.3 | 7.85 | 0.0 | CALM | 0.4 | 12 | 8 | 1031.9 | 92.9 | 2.0 | 1 | 1 | 0 | 0 | 0 | 0 | 16 |
| 17 | 8.3 | -2.0 | -4.9 | 4.9 | 3.41 | 0.8 | CALM | 2.8 | 18 | 8 | 1022.5 | 89.9 | 2.5 | 0 | 0 | 0 | 0 | 0 | 0 | 17 |
| 18 | 8.6 | 2.2 | -0.5 | 5.1 | 7.77 | 0.2 | W | 7.1 | 37 | 1 | 1021.9 | 79.9 | 5.0 | 0 | 0 | 0 | 0 | 0 | 0 | 18 |
| 19 | 10.3 | 5.5 | 4.2 | 5.3 | 0.02 | 6.6 | W | 12.4 | 55 | 8 | 1015.3 | 86.5 | 7.8 | 0 | 0 | 0 | 0 | 0 | 0 | 19 |
| 20 | 9.9 | 7.2 | 4.2 | 6.2 | 4.08 | 0.7 | W | 13.0 | 51 | 6 | 998.8 | 78.1 | 6.7 | 0 | 0 | 0 | 0 | 0 | 0 | 20 |
| 21 | 11.4 | -0.6 | -3.3 | 5.9 | 0.03 | 1.3 | W | 8.3 | 37 | 8 | 1017.3 | 83.8 | 2.9 | 0 | 0 | 0 | 0 | 0 | 0 | 21 |
| 22 | 12.7 | 6.1 | 5.5 | 6.0 | 4.21 | 0.1 | SW | 13.9 | 53 | 1 | 1001.0 | 75.4 | 8.4 | 0 | 0 | 0 | 0 | 0 | 0 | 22 |
| 23 | 6.5 | 2.9 | 0.6 | 6.1 | 5.18 | 0.8 | W | 13.1 | 46 | 3 | 1002.6 | 76.5 | 3.3 | 0 | 0 | 1 | 0 | 1 | 0 | 23 |
| 24 | 9.5 | 1.0 | -2.0 | 5.4 | 0.00 | 7.1 | SW | 7.4 | 30 | 8 | 1009.1 | 88.5 | 3.8 | 0 | 0 | 0 | 0 | 0 | 0 | 24 |
| 25 | 11.6 | 8.5 | 7.2 | 5.7 | 0.00 | 5.5 | S | 11.3 | 44 | 8 | 997.9 | 94.0 | 9.6 | 0 | 0 | 0 | 0 | 0 | 0 | 25 |
| 26 | 11.9 | 8.9 | 7.0 | 6.9 | 5.60 | 0.1 | SW | 13.9 | 65 | 3 | 988.4 | 77.6 | 8.5 | 0 | 0 | 0 | 0 | 0 | 0 | 26 |
| 27 | 7.5 | 2.5 | 0.4 | 6.7 | 5.59 | 1.4 | SW | 12.6 | 39 | 2 | 995.1 | 79.4 | 3.6 | 0 | 0 | 0 | 0 | 0 | 0 | 27 |
| 28 | 9.8 | 2.3 | 0.0 | 6.0 | 7.25 | 0.0 | SW | 7.9 | 32 | 0 | 997.0 | 78.0 | 4.6 | 0 | 0 | 0 | 0 | 0 | 0 | 28 |
| Mean/Total | 10.7 | 4.9 | 2.7 | 6.6 | 87.56 | 48.9 | X | 9.8 | X | 5.5 | 1009.3 | 84.4 | 6.6 | 1 | 1 | 1 | 0 | 1 | 0 | Mean/Total |
| (+3.9) | (+3.5) | (127%) | (140%) |
(*All times GMT*)
Additional Data:
Rainfall Duration 61.6 hours
Air Frost Duration 30.6 hours
Differences from average:
Differences from average shown in red. Reference periods used are as follows: Temperature 25 Years 1973/1997; rainfall 30 Years 1971/2000; sunshine 30 Years 1961/1990.
Observations practice:
Note: In line with standard meteorological practice the 24 hour maximum temperature and rainfall are read at 0900 GMT and credited to the previous day i.e. data shown above for 1st actually read at 0900 GMT on 2nd and represents the previous 24 hours. The 24 hour minimum and grass minimum temperatures are similarly observed at 0900 GMT but are credited to the day of the reading (e.g. observations made at 0900 GMT on 2nd shown against 2nd and represent previous 24 hours). This is the reason why at daily update of the above table the minimum and grass minimum temperatures appear to be "ahead" of the other data mentioned. (This explanation given in response to a query received).
Graphs and Charts:
The graphs and charts accompanying this month's data may be viewed by clicking on the following links:
1. Daily Maximum, Minimum & Grass Minimum Temperatures
2. Daily Maximum & Minimum Temperatures (with 25 Year Comparative Means)
3. Daily Earth (30 cms Depth) Temperature @ 0900 GMT 4. Daily Rainfall 5. Daily Sunshine
6. Daily Maximum Gust & Mean Wind Speed 7. Daily Wind Direction @ 0900 GMT 8. Daily Mean MSL Air Pressure
9. Daily Mean Relative Humidity 10. Thermograph 11. Barograph 12. Hygrograph 13. Anemograph
14. Wind Direction 15. Sunshine Duration 16. Rainfall Intensity & Duration
February 2002 Weather Review:
For a text report of the February 2002 weather in Royston click on the link below:
February (since 1973) at Royston (Iceni) Weather Station:
Mean day maximum temperature (25 years 1973/1997) 6.8°C
Mean night minimum temperature (25 years 1973/1997) 1.4°C
Highest temperature 18.5°C (13th February 1998); lowest temperature -10.5°C (12th & 13th February 1985)
Lowest grass minimum temperature -14.5°C (10th February 1986)
Warmest February 1990 (Mean temperature 8.1°C); coldest February 1986 (Mean temperature -1.6°C)
Average February rainfall (30 years 1971/2000) 35.0 mm
Wettest February 2001 (Rainfall 90.7 mm); driest February 1998 (Rainfall 4.8 mm)
Wettest Day 7th February 2001 (Rainfall 21.8 mm);
Highest number of "rain days" (0.2 mm or more) 21 (2000); lowest number of "rain days" 5 (1998)
Highest number of days with thunder 2 (1995)
Highest number of air frosts 24 (1986)
Highest number of ground frosts 25 (1986)
Highest number of days with snow falling 15 (1986)
Highest number of days with snow lying (ground with more than 50% snow cover @ 0900 GMT) 23 (1986)
|
|
|
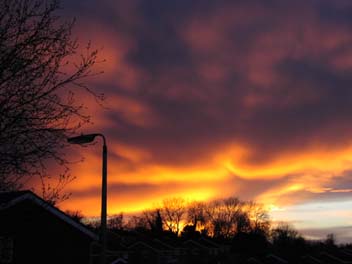
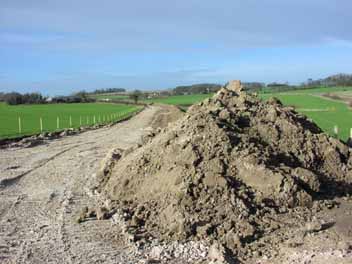
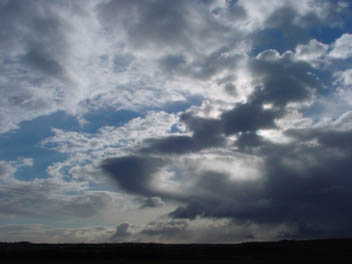
| This unusual sunset over Royston was recorded at 1703 GMT on 9th February 2002. The underside of the clouds is being strongly illuminated by the setting sun in an effect which lasted only a few minutes and disappeared very quickly. It had been a rather windy day and at sunset a WSW wind of mean speed 10 knots gusting to 20 knots was in evidence, and the temperature was 7.5°C. The previous night had been notably mild with a minimum temperature of 9.6°C, but then the temperature achieved a maximum only 1°C higher during the day. Sunshine for the day was 2.2 hours. | A project to install a water pipeline across the countryside to the south and south-east of Royston is currently in progress, this being a view of the site close to Heath Farm (looking westwards) at 1004 GMT on 10th February 2002. Here the top soil has been removed revealing the underlying chalk into which the trench to accommodate the pipeline has been cut and then the ground reinstated. It is a bright and sunny morning, contributing towards a sunshine total for the day of 4.1 hours. A WSW wind of mean speed 11 knots, gusting to 22 knots, is blowing straight into the camera! | In this picture (taken 1.5 km east of Royston at 0903 GMT on 23rd February 2002) the sun has been momentarily covered by the fast moving cloud but is providing sufficient illumination to produce this attractive cloudscape. It is very windy, with the WSW wind gusting to 30 knots and maintaining a mean speed of 10 knots. Although the temperature is 3.5°C the strength of the wind gives an effective wind chill of -7°C! It was a fairly sunny day with 5.2 hours sunshine, and the maximum temperature was 6.5°C, after an overnight minimum of 2.9°C. |
Return to Welcome to Royston (Iceni) Weather Station page
(This page last updated 12th March 2002 2035 GMT)