
Royston (Iceni) Weather Station
Daily Weather Observations - December 2001
| Date | Max | Min | Grass | Earth | Sunshine | Rainfall | Wind | Mean | Max | Cloud | Mean | Mean | Mean | Fog | Fog | Snow | Snow | Hail | Thunder | Date |
| Temp | Temp | Min | (30cm) | (Hrs) | (MM) | Direc- | Wind | Gust | Cover | MSL | Rel. | Temp | (vis.< | (vis.< | or | Lying | 00/00h | 00/00h | ||
| (°C) | (°C) | Temp | Temp | 00/00h | 09/09h | tion | Speed | Speed | (Oktas) | Pressure | Humd | (°C) | 1000m) | 200m | Rain/ | (>50% | ||||
| 09/09h | 09/09h | (°C) | (°C) | 09h | (mph) | (mph) | 09h | (mb) | (%) | 00/00h | 09h | 09h | Snow | cover | ||||||
| 09/09h | 09h | 00/00h | 00/00h | 00/00h | 00/00h | 00/00h | 09h) | |||||||||||||
| 1 | 11.0 | 11.0 | 9.9 | 9.5 | 2.26 | 2.2 | W | 6.0 | 32 | 8 | 1013.0 | 93.3 | 9.3 | 0 | 0 | 0 | 0 | 0 | 0 | 1 |
| 2 | 5.5 | 1.0 | -2.5 | 8.6 | 1.94 | 0.0 | CALM | 0.6 | 7 | 6 | 1025.6 | 95.0 | 3.3 | 0 | 0 | 0 | 0 | 0 | 0 | 2 |
| 3 | 9.9 | 1.5 | -1.5 | 7.6 | 1.23 | 4.3 | S | 3.2 | 32 | 7 | 1019.0 | 97.1 | 5.4 | 0 | 0 | 0 | 0 | 0 | 0 | 3 |
| 4 | 10.2 | 8.4 | 6.4 | 7.9 | 5.43 | 5.0 | SW | 8.9 | 39 | 0 | 1011.1 | 84.1 | 7.8 | 0 | 0 | 0 | 0 | 0 | 0 | 4 |
| 5 | 12.9 | 5.6 | 4.5 | 7.5 | 2.97 | 1.0 | S | 10.4 | 46 | 8 | 1014.1 | 86.6 | 8.0 | 0 | 0 | 0 | 0 | 0 | 0 | 5 |
| 6 | 6.9 | 1.5 | -2.1 | 7.5 | 4.99 | 0.0 | CALM | 1.2 | 21 | 1 | 1032.7 | 90.9 | 4.2 | 0 | 0 | 0 | 0 | 0 | 0 | 6 |
| 7 | 9.5 | 4.9 | 1.7 | 6.7 | 5.64 | 0.0 | S | 2.3 | 16 | 7 | 1037.5 | 92.8 | 5.6 | 0 | 0 | 0 | 0 | 0 | 0 | 7 |
| 8 | 7.3 | 2.5 | -1.6 | 6.3 | 6.60 | 0.0 | SE | 1.6 | 14 | 0 | 1040.1 | 94.0 | 3.6 | 0 | 0 | 0 | 0 | 0 | 0 | 8 |
| 9 | 4.9 | -1.2 | -4.9 | 5.6 | 3.73 | 0.0 | CALM | 0.1 | 12 | 4 | 1040.8 | 94.6 | 1.2 | 1 | 0 | 0 | 0 | 0 | 0 | 9 |
| 10 | 2.7 | -1.5 | -4.1 | 5.0 | 0.00 | 0.4 | CALM | 0.0 | 7 | 8 | 1041.6 | 99.8 | -0.6 | 1 | 1 | 0 | 0 | 0 | 0 | 10 |
| 11 | 5.0 | -0.5 | -0.4 | 5.0 | 0.00 | TR | N | 0.6 | 12 | 8 | 1041.0 | 99.9 | 1.8 | 1 | 1 | 0 | 0 | 0 | 0 | 11 |
| 12 | 6.1 | -0.5 | -4.6 | 5.1 | 0.00 | TR | CALM | 0.8 | 16 | 8 | 1036.0 | 96.3 | 2.9 | 0 | 0 | 0 | 0 | 0 | 0 | 12 |
| 13 | 6.0 | 5.2 | 4.5 | 5.5 | 0.00 | 0.1 | NE | 2.3 | 16 | 8 | 1036.2 | 92.7 | 4.9 | 0 | 0 | 0 | 0 | 0 | 0 | 13 |
| 14 | 2.0 | -2.9 | -6.7 | 5.5 | 6.46 | 0.0 | CALM | 0.3 | 9 | 0 | 1041.0 | 92.0 | -1.1 | 0 | 0 | 0 | 0 | 0 | 0 | 14 |
| 15 | 3.4 | -4.1 | -7.3 | 4.3 | 2.16 | 0.3 | CALM | 0.6 | 18 | 1 | 1040.3 | 94.7 | -0.7 | 0 | 0 | 0 | 0 | 0 | 0 | 15 |
| 16 | 3.5 | 1.5 | 0.0 | 3.8 | 0.00 | 0.0 | NE | 1.6 | 18 | 8 | 1040.5 | 83.8 | 2.1 | 0 | 0 | 0 | 0 | 0 | 0 | 16 |
| 17 | 5.0 | -0.5 | -4.2 | 3.9 | 0.42 | 1.1 | W | 0.5 | 14 | 6 | 1040.6 | 95.1 | 2.6 | 0 | 0 | 0 | 0 | 0 | 0 | 17 |
| 18 | 5.5 | 2.9 | 2.6 | 4.5 | 0.02 | 0.0 | CALM | 0.0 | 5 | 8 | 1039.9 | 99.2 | 4.0 | 1 | 0 | 0 | 0 | 0 | 0 | 18 |
| 19 | 5.5 | 2.1 | -0.9 | 5.0 | 3.17 | 1.1 | W | 4.2 | 23 | 1 | 1031.6 | 90.5 | 3.8 | 0 | 0 | 0 | 0 | 0 | 0 | 19 |
| 20 | 3.9 | -1.9 | -5.8 | 4.8 | 4.77 | 0.0 | CALM | 3.4 | 30 | 0 | 1030.4 | 93.7 | 0.2 | 0 | 0 | 0 | 0 | 0 | 0 | 20 |
| 21 | 6.7 | 0.5 | -1.0 | 4.0 | 0.00 | 2.2 | W | 10.3 | 35 | 7 | 1013.6 | 88.9 | 3.2 | 0 | 0 | 0 | 0 | 0 | 0 | 21 |
| 22 | 1.5 | -2.1 | -5.0 | 4.0 | 5.08 | TR | NW | 6.0 | 28 | 0 | 1014.7 | 85.9 | -0.8 | 0 | 0 | 1 | 0 | 0 | 0 | 22 |
| 23 | 5.2 | -3.5 | -6.8 | 3.4 | 6.58 | 1.5 | W | 5.1 | 30 | 1 | 1020.2 | 87.5 | -0.5 | 0 | 0 | 0 | 1 | 0 | 0 | 23 |
| 24 | 8.2 | 2.2 | 1.2 | 3.0 | 0.50 | 1.8 | W | 12.6 | 39 | 8 | 1007.1 | 88.4 | 5.8 | 0 | 0 | 0 | 0 | 0 | 0 | 24 |
| 25 | 4.5 | 4.0 | 2.5 | 3.8 | 0.00 | 0.2 | NW | 5.4 | 30 | 8 | 1000.4 | 85.7 | 3.2 | 0 | 0 | 1 | 0 | 0 | 0 | 25 |
| 26 | 4.1 | -2.5 | -5.5 | 3.5 | 5.79 | 1.1 | NW | 5.8 | 23 | 0 | 1009.6 | 87.1 | -0.8 | 0 | 0 | 0 | 0 | 0 | 0 | 26 |
| 27 | 8.4 | 0.0 | -1.8 | 3.0 | 1.17 | 0.0 | SW | 10.0 | 28 | 8 | 1004.7 | 92.8 | 4.7 | 0 | 0 | 0 | 0 | 0 | 0 | 27 |
| 28 | 6.4 | 5.4 | 2.9 | 3.4 | 6.08 | 0.0 | W | 10.8 | 46 | 1 | 1002.7 | 72.6 | 5.1 | 0 | 0 | 0 | 0 | 0 | 0 | 28 |
| 29 | 2.0 | 0.9 | -0.2 | 3.4 | 1.19 | 0.3 | SW | 5.1 | 23 | 8 | 1002.1 | 86.2 | 0.5 | 0 | 0 | 1 | 0 | 0 | 0 | 29 |
| 30 | 2.7 | -1.0 | -3.4 | 3.0 | 4.00 | 0.1 | W | 5.3 | 23 | 7 | 1012.3 | 90.0 | -0.1 | 0 | 0 | 1 | 0 | 0 | 0 | 30 |
| 31 | 1.9 | -3.8 | -7.6 | 2.8 | 6.58 | 0.0 | W | 2.4 | 14 | 0 | 1032.5 | 89.1 | -1.6 | 0 | 0 | 0 | 1 | 0 | 0 | 31 |
| Mean/Total | 5.8 | 1.1 | -1.3 | 5.1 | 88.76 | 22.7 | X | 4.1 | X | 4.7 | 1024.9 | 91.0 | 2.8 | 4 | 2 | 4 | 2 | 0 | 0 | Mean/Total |
| (-1.3) | (-1.9) | (189%) | (43%) |
(*All times GMT*)
Differences from average:
Differences from average shown in red. Reference periods used are as follows: Temperature 25 Years 1973/1997; rainfall 30 Years 1971/2000; sunshine 30 Years 1961/1990.
Observations procedure:
Note: In line with standard meteorological practice the 24 hour maximum temperature and rainfall are read at 0900 GMT and credited to the previous day i.e. data shown above for 1st actually read at 0900 GMT on 2nd and represents the previous 24 hours. The 24 hour minimum and grass minimum temperatures are similarly observed at 0900 GMT but are credited to the day of the reading (e.g. observations made at 0900 GMT on 2nd shown against 2nd and represent previous 24 hours). This is the reason why at daily update of the above table the minimum and grass minimum temperatures appear to be "ahead" of the other data mentioned. (This explanation given in response to a query received).
Graphs and Charts:
Click on the links below to view this months graphs and charts.......
1. Daily Maximum, Minimum & Grass Minimum Temperatures
2. Daily Maximum & Minimum Temperatures (with 25 Year Comparative Means
3. Daily Earth (30 cms Depth) Temperatures @ 0900 GMT 4. Daily Rainfall 5. Daily Sunshine
6. Daily Maximum Gust & Mean Wind Speed 7. Daily Wind Direction @ 0900 GMT
8. Daily Mean MSL Air Pressure 9. Daily Mean Relative Humidity
10. Thermograph 11. Barograph 12. Hygrograph 13. Anemograph
14. Wind Direction 15. Sunshine Duration 16. Rainfall Intensity & Duration
December 2001 Weather Review:
....and click on the following link for a text report of the December 2001 weather in Royston
December (since 1972) at Royston (Iceni) Weather Station:
Mean day maximum temperature (25 years 1973/1997) 7.1°C
Mean night minimum temperature (25 years 1973/1997) 3.0°C
Highest temperature 15.1°C (2nd December 1985); lowest temperature -9.8°C (29th December 1995)
Lowest grass minimum temperature -14.6°C (13th December 1981)
Warmest December 1974 (Mean temperature 7.8°C); coldest December 1981 (Mean temperature 0.4°C)
Average December rainfall (30 years 1971/2000) 52.8 mm
Wettest December 1989 (Rainfall 122.4 mm); driest December 1991 (Rainfall 10.3 mm)
Wettest Day 27th December 1979 (Rainfall 31.5 mm)
Highest number of "rain days" (0.2 mm or more) 22 (1978); lowest number of "rain days" 8 (1991)
Highest number of days with thunder 3 (1989)
Highest number of air frosts 20 (1981)
Highest number of ground frosts 25 (1981)
Highest number of days with snow falling 10 (1981)
Highest number of days with snow lying (ground with more than 50% snow cover @ 0900 GMT) 23 (1981)
|
|
|
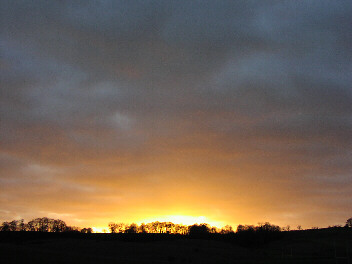
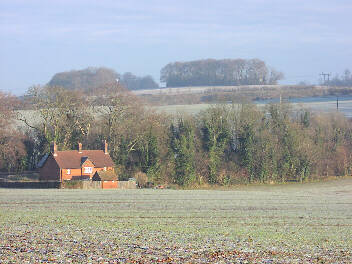
| This picture shows a particularly bright setting sun over Therfield Heath, Royston at 1536 GMT on 5th December 2001. The colouring does not extend very far above the horizon, indicating fair weather to come. In fact, the next four days were completely dry (but cloudy) and only 0.8 mm rainfall was recorded in the 7 days after that! The temperature is 9.5°C after a maximum temperature for the day of 12.9°C. A gusty westerly wind is sweeping across the Heath, mean wind speed 15 knots, gusting to 30 knots. Sunshine for the day was 3.0 hours. | The morning of 15th December 2001 dawned frosty, as in evidence in this scene (at 0956 GMT) adjacent to the B1039 Royston/Saffron Walden Road about 3 km from Royston. The black barn in the middle distance is a familiar landmark to travellers along this road, the site of which provides a fine vantage point for excellent views of the countryside in all directions, with the occasional farmhouse being the only evidence of habitation. The temperature is -2.9°C after an overnight minimum of -4.1°C, and grass minimum of -7.3°C. | Seen a little later (at 1026 GMT) on the same morning as the previous photograph, this vantage point on the Burloes Estate affords a fine view of Hyde Hill, and also the South Cambridgeshire Plain (visible to the left but not in the picture). The line of trees in the middle distance hides the old A505 Newmarket Road (which is on a raised embankment at this point), whilst beyond can be seen the top of the cutting made in Hyde Hill for the A505 Royston By-Pass. The earlier dead calm has now been interspersed with the occasional 4 knot gust from the NE. |
Return to Welcome to Royston (Iceni) Weather Station page
(This page last updated 9th January 2002 2023 GMT)