Royston (Iceni) Weather Station
Daily Weather Observations - October 2001
| Date | Max | Min | Grass | Earth | Sunshine | Rainfall | Wind | Mean | Max | Cloud | Mean | Mean | Mean | Fog | Fog | Snow | Snow | Hail | Thunder | Date |
| Temp | Temp | Min | (30cm) | (Hrs) | (MM) | Direc- | Wind | Gust | Cover | MSL | Rel. | Temp | (vis.< | (vis.< | or | Lying | 00/00h | 00/00h | ||
| (°C) | (°C) | Temp | Temp | 00/00h | 09/09h | tion | Speed | Speed | (Oktas) | Pressure | Humd | (°C) | 1000m) | 200m | Rain/ | (>50% | ||||
| 09/09h | 09/09h | (°C) | (°C) | 09h | (mph) | (mph) | 09h | (mb) | (%) | 00/00h | 09h | 09h | Snow | cover | ||||||
| 09/09h | 09h | 00/00h | 00/00h | 00/00h | 00/00h | 00/00h | 09h) | |||||||||||||
| 1 | 18.4 | 13.4 | 11.4 | 14.9 | 2.97 | 7.9 | SW | 12.1 | 41 | 8 | 997.2 | 83.6 | 15.4 | 0 | 0 | 0 | 0 | 0 | 0 | 1 |
| 2 | 17.2 | 12.2 | 11.6 | 14.6 | 2.56 | 0.1 | S | 7.0 | 25 | 8 | 1001.5 | 88.0 | 14.1 | 0 | 0 | 0 | 0 | 0 | 0 | 2 |
| 3 | 18.5 | 11.0 | 9.5 | 14.5 | 8.70 | TR | SW | 7.9 | 32 | 1 | 1008.0 | 82.4 | 13.7 | 0 | 0 | 0 | 0 | 0 | 0 | 3 |
| 4 | 17.8 | 10.4 | 9.0 | 14.0 | 7.27 | 0.2 | SW | 6.6 | 28 | 6 | 1010.7 | 84.0 | 13.7 | 0 | 0 | 0 | 0 | 0 | 0 | 4 |
| 5 | 20.0 | 13.3 | 12.1 | 14.2 | 8.65 | 0.3 | S | 5.4 | 30 | 5 | 1004.0 | 82.7 | 15.7 | 0 | 0 | 0 | 0 | 0 | 0 | 5 |
| 6 | 18.0 | 12.5 | 12.0 | 14.7 | 6.18 | 1.2 | S | 6.2 | 30 | 4 | 1001.1 | 87.0 | 14.7 | 0 | 0 | 0 | 0 | 0 | 0 | 6 |
| 7 | 15.4 | 11.4 | 9.7 | 14.1 | 1.82 | 7.3 | S | 8.7 | 48 | 2 | 993.6 | 92.5 | 12.5 | 0 | 0 | 0 | 0 | 0 | 0 | 7 |
| 8 | 16.0 | 11.0 | 9.5 | 13.6 | 4.51 | 5.0 | SW | 10.0 | 41 | 2 | 994.8 | 89.8 | 12.1 | 0 | 0 | 0 | 0 | 0 | 0 | 8 |
| 9 | 15.9 | 10.1 | 8.9 | 13.4 | 1.60 | 0.6 | SW | 6.5 | 30 | 6 | 1008.6 | 88.5 | 12.1 | 0 | 0 | 0 | 0 | 0 | 0 | 9 |
| 10 | 16.6 | 8.9 | 7.5 | 13.1 | 1.12 | 0.0 | SW | 8.5 | 35 | 7 | 1021.3 | 88.0 | 12.8 | 0 | 0 | 0 | 0 | 0 | 0 | 10 |
| 11 | 18.6 | 14.7 | 13.5 | 13.5 | 2.98 | 0.0 | SW | 6.5 | 28 | 3 | 1024.5 | 91.5 | 15.8 | 0 | 0 | 0 | 0 | 0 | 0 | 11 |
| 12 | 22.0 | 10.5 | 9.5 | 13.9 | 7.81 | 0.0 | S | 3.8 | 21 | 4 | 1021.4 | 87.0 | 15.8 | 0 | 0 | 0 | 0 | 0 | 0 | 12 |
| 13 | 23.0 | 13.8 | 11.0 | 14.3 | 3.84 | 0.0 | S | 1.0 | 12 | 7 | 1018.5 | 90.1 | 17.9 | 0 | 0 | 0 | 0 | 0 | 0 | 13 |
| 14 | 19.5 | 12.6 | 10.5 | 14.9 | 2.24 | 2.8 | SW | 3.3 | 23 | 2 | 1011.1 | 93.3 | 16.2 | 0 | 0 | 0 | 0 | 0 | 0 | 14 |
| 15 | 18.5 | 14.4 | 12.8 | 15.0 | 2.41 | 3.4 | S | 5.2 | 28 | 8 | 1009.2 | 92.9 | 14.4 | 0 | 0 | 0 | 0 | 0 | 0 | 15 |
| 16 | 16.4 | 8.7 | 7.5 | 14.4 | 4.61 | 0.0 | S | 4.1 | 18 | 7 | 1023.2 | 85.6 | 11.7 | 0 | 0 | 0 | 0 | 0 | 0 | 16 |
| 17 | 18.2 | 10.6 | 8.6 | 13.8 | 5.05 | 2.2 | SE | 3.3 | 25 | 8 | 1015.7 | 87.4 | 14.0 | 0 | 0 | 0 | 0 | 0 | 0 | 17 |
| 18 | 17.2 | 14.5 | 13.5 | 14.0 | 3.64 | 0.0 | SW | 3.0 | 18 | 8 | 1008.9 | 90.3 | 14.2 | 0 | 0 | 0 | 0 | 0 | 0 | 18 |
| 19 | 15.6 | 9.4 | 5.8 | 13.5 | 0.13 | 2.4 | SE | 2.1 | 30 | 7 | 1007.7 | 95.8 | 12.8 | 0 | 0 | 0 | 0 | 0 | 0 | 19 |
| 20 | 16.7 | 12.5 | 10.0 | 13.6 | 0.33 | 51.8 | S | 1.2 | 18 | 7 | 1000.7 | 96.7 | 15.2 | 0 | 0 | 0 | 0 | 0 | 0 | 20 |
| 21 | 11.4 | 10.5 | 9.1 | 13.9 | 0.00 | 35.1 | W | 6.8 | 28 | 8 | 1000.3 | 99.6 | 10.7 | 0 | 0 | 0 | 0 | 0 | 0 | 21 |
| 22 | 16.9 | 10.1 | 9.6 | 13.0 | 4.97 | 4.0 | SW | 3.7 | 23 | 8 | 1008.7 | 91.2 | 12.6 | 0 | 0 | 0 | 0 | 0 | 0 | 22 |
| 23 | 17.0 | 13.2 | 11.2 | 13.2 | 5.90 | 1.6 | S | 5.2 | 25 | 6 | 1009.6 | 93.0 | 14.0 | 0 | 0 | 0 | 0 | 0 | 0 | 23 |
| 24 | 16.5 | 11.0 | 9.5 | 13.0 | 4.75 | 1.1 | S | 5.7 | 28 | 5 | 1014.2 | 92.8 | 12.3 | 0 | 0 | 0 | 0 | 0 | 0 | 24 |
| 25 | 16.0 | 10.4 | 8.5 | 12.7 | 3.51 | 0.8 | SW | 7.4 | 30 | 5 | 1018.7 | 89.8 | 13.0 | 0 | 0 | 0 | 0 | 0 | 0 | 25 |
| 26 | 15.6 | 13.0 | 12.1 | 12.9 | 0.20 | 7.3 | S | 7.8 | 35 | 8 | 1010.2 | 93.4 | 13.4 | 0 | 0 | 0 | 0 | 0 | 0 | 26 |
| 27 | 16.2 | 10.1 | 9.0 | 12.9 | 7.59 | 1.9 | SW | 4.7 | 21 | 1 | 1015.6 | 87.8 | 11.8 | 0 | 0 | 0 | 0 | 0 | 0 | 27 |
| 28 | 15.5 | 9.5 | 8.2 | 12.3 | 7.85 | 0.0 | SW | 1.5 | 14 | 5 | 1025.2 | 89.5 | 10.8 | 0 | 0 | 0 | 0 | 0 | 0 | 28 |
| 29 | 14.2 | 8.1 | 7.0 | 11.6 | 2.70 | 0.0 | SW | 7.5 | 30 | 7 | 1023.4 | 90.1 | 11.2 | 0 | 0 | 0 | 0 | 0 | 0 | 29 |
| 30 | 18.5 | 11.5 | 10.5 | 11.9 | 8.73 | 0.8 | S | 11.5 | 35 | 0 | 1012.9 | 86.6 | 14.5 | 0 | 0 | 0 | 0 | 0 | 0 | 30 |
| 31 | 12.4 | 8.7 | 7.0 | 12.0 | 6.62 | 0.0 | W | 9.0 | 41 | 0 | 1020.9 | 78.5 | 9.4 | 0 | 0 | 0 | 0 | 0 | 0 | 31 |
| Mean/Total | 17.1 | 11.4 | 9.9 | 13.6 | 131.24 | 137.8 | X | 5.9 | X | 5.3 | 1011.0 | 89.3 | 13.5 | 0 | 0 | 0 | 0 | 0 | 0 | Mean/Total |
| (+2.8) | (+3.8) | (121%) | (242%) |
*All times GMT*
Differences from average:
Differences from average shown in red. Reference periods used are as follows: Temperature 25 Years 1973/1997; rainfall 30 Years 1971/2000; sunshine 30 Years 1961/1990.
Observations practice:
Note: In line with standard meteorological practice the 24 hour maximum temperature and rainfall are read at 0900 GMT and credited to the previous day i.e. data shown above for 1st actually read at 0900 GMT on 2nd and represents the previous 24 hours. The 24 hour minimum and grass minimum temperatures are similarly observed at 0900 GMT but are credited to the day of the reading (e.g. observations made at 0900 GMT on 2nd shown against 2nd and represent previous 24 hours). This is the reason why at daily update of the above table the minimum and grass minimum temperatures appear to be "ahead" of the other data mentioned. (This explanation given in response to a query received).
Graphs and Charts:
Click on the following links to view this month's graphs and charts......
1. Daily Maximum, Minimum, & Grass Minimum Temperatures
2. Daily Maximum & Minimum Temperatures (with 25 Year Comparative Means)
3. Daily Earth (30 cms) Depth Temperature 4. Daily Rainfall 5. Daily Sunshine
6. Daily Maximum Gust & Mean Wind Speed 7. Daily Wind Direction @ 0900 GMT
8. Daily Mean MSL Air Pressure 9. Daily Mean Relative Humidity
10. Thermograph 11. Barograph 12. Hygrograph 13. Anemograph 14. Wind Direction
15. Sunshine Duration 16. Rainfall Intensity & Duration 17. Hyetogram 21st October 2001
October 2001 Weather Review:
........ and for a text report of the October 2001 weather in Royston click on the linl below
October (since 1972) at Royston (Iceni) Weather Station:
Mean day maximum temperature (25 years 1973/1997) 14.3°C
Mean night minimum temperature (25 years 1973/1997) 7.6°C
Highest temperature 27.5°C (1st October 1985); lowest temperature -3.6°C (29th October 1997)
Lowest grass minimum temperature -8.3°C (29th October 1997)
Warmest October 1995 (Mean temperature 13.8°C); coldest October 1974 (Mean temperature 7.3°C)
Highest no. of days with air frost 5 (1997); highest no. of days with ground frost 11 (1997)
Average October rainfall (30 years 1971/2000) 57.0 mm
Wettest October 2000 (Rainfall 137.7 mm); driest October 1972 (Rainfall 4.1 mm)
Wettest Day 2nd October 1982 (Rainfall 38.1 mm);
Highest number of "rain days" (0.2 mm or more) 23 (2000); lowest number of "rain days" 3 (1972)
Highest number of days with thunder 3 (1984)
|
|
|
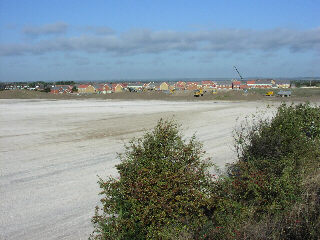
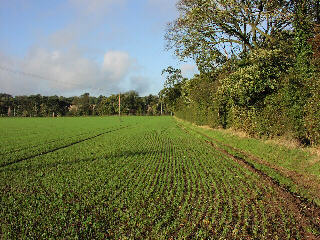
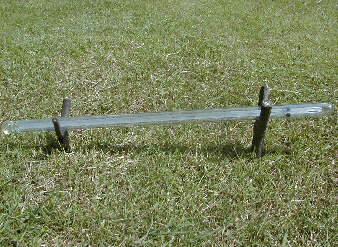
| This scene (as viewed at 0837 GMT on 3rd October 2001) depicts the site of the housing and sports/leisure development on the flatter, northern side of Royston. Removal of the top soil prior to levelling of this part of the site has revealed the underlying chalk of the district and created a scene reminiscent of a winter snowfall. The temperature is 13.4°C, having risen from its overnight minimum of 11.0°C, and later achieving a maximum of 18.5°C for the day. The bright sunshine apparent in this picture continued for much of the day and registered a daily total of 8.7 hours. The wind direction at the time of the photograph was SW, and the mean wind speed was 9 knots, gusting to 20 knots. | There is little visible evidence in this picture (taken on the Icknield Way 2.5 km east of Royston on 23rd October 2001 at 0829 GMT) of the exceptional rainfall event which occurred only 48 hours earlier. In a 17 hour period on Sunday, 21st October 2001 an amount of 86.9 millimetres of rainfall was recorded in Royston, an event estimated by the UK Meteorological Office to have a return period of 140 years. The torrential rainfall has been replaced here by bright sunshine (total for the day 5.9 hours) in a temperature of 13.9°C, after an overnight minimum of 13.2°C (day maximum 17.0°C). Note the rapidly growing winter cereal crop in the consistently mild October weather. | This picture illustrates the measurement of the grass minimum temperature at Royston (Iceni) Weather Station. The glass sheathed grass minimum thermometer is laid almost horizontally (on nothing more sophisticated than a couple of twigs in this instance) so that the bulb is just touching the tips of the grass. The bulb must also be a little lower than the top of the thermometer in order to aid the movement down the capillary tube of the metal index (which is just discernible in the middle of the thermometer) by the contracting alcohol column. This thermometer is read daily at 0900 GMT with the reading being credited to the day of the reading. If the reading drops below 0.0°C a ground frost is registered. |
Return to Welcome to Royston (Iceni) Weather Station page
(This page last updated 9th November 2001 2126 GMT)