Royston (Iceni) Weather Station
Daily Weather Observations - August 2001
| Date | Max | Min | Grass | Earth | Sunshine | Rainfall | Wind | Mean | Max | Cloud | Mean | Mean | Mean | Fog | Fog | Snow | Snow | Hail | Thunder | Date |
| Temp | Temp | Min | (30cm) | (Hrs) | (MM) | Direc- | Wind | Gust | Cover | MSL | Rel. | Temp | (vis.< | (vis.< | or | Lying | 00/00h | 00/00h | ||
| (°C) | (°C) | Temp | Temp | 00/00h | 09/09h | tion | Speed | Speed | (Oktas) | Pressure | Humd | (°C) | 1000m) | 200m | Rain/ | (>50% | ||||
| 09/09h | 09/09h | (°C) | (°C) | 09h | (mph) | (mph) | 09h | (mb) | (%) | 00/00h | 09h | 09h | Snow | cover | ||||||
| 09/09h | 09h | 00/00h | 00/00h | 00/00h | 00/00h | 00/00h | 09h) | |||||||||||||
| 1 | 25.1 | 11.6 | 8.7 | 20.5 | 14.48 | TR | S | 2.0 | 18 | 0 | 1023.8 | 64.6 | 18.2 | 0 | 0 | 0 | 0 | 0 | 0 | 1 |
| 2 | 21.5 | 12.5 | 9.7 | 20.2 | 0.11 | 9.8 | N | 0.5 | 14 | 8 | 1011.0 | 88.9 | 16.2 | 0 | 0 | 0 | 0 | 0 | 0 | 2 |
| 3 | 24.0 | 14.5 | 13.9 | 19.5 | 7.25 | TR | W | 5.0 | 25 | 1 | 1008.5 | 77.7 | 18.2 | 0 | 0 | 0 | 0 | 0 | 0 | 3 |
| 4 | 22.4 | 12.5 | 10.5 | 20.1 | 6.81 | 4.1 | SW | 4.4 | 28 | 2 | 1012.9 | 76.6 | 16.1 | 0 | 0 | 0 | 0 | 0 | 1 | 4 |
| 5 | 22.5 | 12.5 | 12.2 | 19.5 | 8.26 | 0.7 | W | 4.6 | 25 | 6 | 1013.6 | 70.1 | 17.2 | 0 | 0 | 0 | 0 | 0 | 0 | 5 |
| 6 | 22.5 | 15.0 | 14.0 | 19.5 | 1.09 | 3.1 | S | 6.8 | 28 | 8 | 1008.3 | 85.9 | 17.7 | 0 | 0 | 0 | 0 | 0 | 1 | 6 |
| 7 | 20.6 | 13.7 | 12.2 | 19.1 | 3.59 | 0.8 | SW | 6.7 | 28 | 7 | 1002.8 | 82.2 | 16.8 | 0 | 0 | 0 | 0 | 0 | 0 | 7 |
| 8 | 20.7 | 13.5 | 12.6 | 18.7 | 5.62 | 5.5 | SW | 6.7 | 35 | 5 | 1001.9 | 80.6 | 15.5 | 0 | 0 | 0 | 0 | 0 | 1 | 8 |
| 9 | 16.2 | 12.9 | 12.1 | 18.5 | 0.00 | 7.1 | CALM | 1.0 | 16 | 8 | 1010.8 | 94.3 | 13.1 | 0 | 0 | 0 | 0 | 0 | 0 | 9 |
| 10 | 19.5 | 8.9 | 7.7 | 17.4 | 9.09 | 0.0 | NW | 4.0 | 23 | 3 | 1022.7 | 71.7 | 14.3 | 0 | 0 | 0 | 0 | 0 | 0 | 10 |
| 11 | 21.2 | 11.2 | 9.5 | 17.1 | 3.94 | 10.3 | SW | 7.2 | 32 | 6 | 1023.2 | 74.0 | 16.6 | 0 | 0 | 0 | 0 | 0 | 0 | 11 |
| 12 | 19.1 | 15.5 | 14.4 | 17.6 | 0.00 | 4.1 | SW | 8.8 | 30 | 8 | 1014.3 | 93.2 | 17.0 | 0 | 0 | 0 | 0 | 0 | 0 | 12 |
| 13 | 24.0 | 16.8 | 16.0 | 17.8 | 4.65 | 0.0 | SW | 7.1 | 30 | 8 | 1011.0 | 82.0 | 19.8 | 0 | 0 | 0 | 0 | 0 | 0 | 13 |
| 14 | 26.6 | 16.9 | 16.0 | 18.3 | 10.26 | 0.0 | SW | 4.1 | 23 | 2 | 1011.2 | 75.6 | 21.1 | 0 | 0 | 0 | 0 | 0 | 0 | 14 |
| 15 | 30.9 | 18.5 | 16.3 | 19.4 | 9.64 | 0.1 | S | 5.5 | 28 | 0 | 1008.2 | 64.8 | 23.2 | 0 | 0 | 0 | 0 | 0 | 0 | 15 |
| 16 | 22.6 | 16.5 | 16.0 | 19.9 | 6.67 | 0.0 | W | 6.8 | 35 | 6 | 1011.1 | 70.5 | 18.4 | 0 | 0 | 0 | 0 | 0 | 0 | 16 |
| 17 | 23.5 | 11.0 | 10.1 | 19.2 | 9.22 | 0.0 | SW | 3.7 | 18 | 1 | 1016.1 | 70.7 | 17.1 | 0 | 0 | 0 | 0 | 0 | 0 | 17 |
| 18 | 23.8 | 14.0 | 11.0 | 19.0 | 1.75 | 6.2 | SE | 0.8 | 16 | 7 | 1008.9 | 76.6 | 18.5 | 0 | 0 | 0 | 0 | 0 | 0 | 18 |
| 19 | 22.1 | 15.7 | 14.5 | 19.0 | 4.93 | 2.0 | S | 5.4 | 32 | 7 | 1000.7 | 88.9 | 18.0 | 0 | 0 | 0 | 0 | 0 | 0 | 19 |
| 20 | 22..0 | 14.4 | 12.9 | 18.9 | 9.88 | 0.0 | W | 3.8 | 21 | 6 | 1012.5 | 69.5 | 17.6 | 0 | 0 | 0 | 0 | 0 | 0 | 20 |
| 21 | 24.0 | 11.2 | 8.5 | 19.5 | 11.32 | 0.0 | SW | 4.3 | 25 | 0 | 1017.1 | 71.3 | 18.2 | 0 | 0 | 0 | 0 | 0 | 0 | 21 |
| 22 | 25.5 | 15.0 | 13.0 | 18.9 | 8.66 | 0.0 | N | 1.5 | 16 | 6 | 1020.9 | 70.4 | 20.1 | 0 | 0 | 0 | 0 | 0 | 0 | 22 |
| 23 | 24.4 | 16.2 | 14.1 | 19.2 | 0.60 | 0.1 | SE | 1.2 | 12 | 8 | 1018.7 | 75.2 | 20.3 | 0 | 0 | 0 | 0 | 0 | 0 | 23 |
| 24 | 28.8 | 18.3 | 15.7 | 19.5 | 9.96 | 0.0 | S | 3.6 | 23 | 3 | 1014.8 | 67.9 | 22.7 | 0 | 0 | 0 | 0 | 0 | 0 | 24 |
| 25 | 30.2 | 14.6 | 11.4 | 19.9 | 11.71 | 0.0 | SE | 1.9 | 21 | 4 | 1013.5 | 74.0 | 22.2 | 0 | 0 | 0 | 0 | 0 | 0 | 25 |
| 26 | 20.0 | 17.2 | 16.5 | 20.1 | 0.0 | 0.4 | N | 1.1 | 14 | 8 | 1016.3 | 92.3 | 17.8 | 0 | 0 | 0 | 0 | 0 | 0 | 26 |
| 27 | 22.5 | 12.3 | 11.4 | 19.2 | 12.55 | 0.0 | N | 1.4 | 14 | 0 | 1021.9 | 66.2 | 16.6 | 0 | 0 | 0 | 0 | 0 | 0 | 27 |
| 28 | 22.6 | 9.4 | 7.2 | 18.8 | 11.40 | 0.0 | S | 1.4 | 16 | 4 | 1020.1 | 66.8 | 16.0 | 0 | 0 | 0 | 0 | 0 | 0 | 28 |
| 29 | 22.2 | 10.8 | 8.4 | 18.5 | 8.23 | 1.3 | SE | 2.1 | 18 | 5 | 1014.2 | 73.3 | 16.4 | 0 | 0 | 0 | 0 | 0 | 0 | 29 |
| 30 | 19.0 | 14.5 | 13.6 | 18.5 | 0.00 | 2.5 | S | 0.6 | 14 | 8 | 1009.3 | 87.8 | 16.1 | 0 | 0 | 0 | 0 | 0 | 0 | 30 |
| 31 | 19.7 | 10.8 | 10.0 | 18.0 | 5.24 | 3.4 | W | 2.6 | 23 | 7 | 1011.2 | 88.4 | 13.9 | 0 | 0 | 0 | 0 | 0 | 1 | 31 |
| Mean/Total | 22.9 | 13.8 | 12.3 | 19.0 | 196.9 | 61.5 | X | 3.8 | X | 4.9 | 1013.3 | 77.2 | 17.8 | 0 | 0 | 0 | 0 | 0 | 4 | Mean/Total |
| (+0.7) | (+1.4) | (111%) | (124%) |
Differences from average shown in red. Reference periods used - Temperature 25 years 1973/1997; Rainfall 35 years 1971/2000; Sunshine 30 years 1961/1990.
Note: In line with standard meteorological practice the 24 hour maximum temperature and rainfall are read at 0900 GMT and credited to the previous day e.g. data shown above for 1st actually read at 0900 GMT on 2nd and represents the previous 24 hours. The 24 hour minimum and grass minimum temperatures are similarly observed at 0900 GMT but are credited to the day of the reading (e.g. observations made at 0900 GMT on 2nd shown against 2nd and represent previous 24 hours). This is the reason why at daily update of the above table the minimum and grass minimum temperatures appear to be "ahead" of the other data mentioned. (This explanation given in response to a query received).
Click on the links below to view this month's graphs and charts.......
1. Daily Maximum, Minimum, & Grass Minimum Temperatures
2. Daily Maximum & Minimum Temperatures (with 25 Year Comparative Means)
3. Daily Earth (30 cms depth) Temperature @ 0900 GMT 4. Daily Rainfall 5. Daily Sunshine
6. Daily Maximum Gust & Mean Wind Speed 7. Daily Wind Direction @ 0900 GMT
8. Daily Mean MSL Air Pressure 9. Daily Mean Relative Humidity
10. Thermograph 11. Barograph 12. Hygrograph 13. Anemograph 14. Wind Direction
15. Sunshine Duration 16. Rainfall Intensity & Duration
.........and to view a text report of the August 2001 weather in Royston click on the link below
August (since 1972) at Royston (Iceni) Weather Station:
Mean day maximum temperature (25 years 1973/1997) 22.2°C
Mean night minimum temperature (25 years 1973/1997) 12.4°C
Highest temperature 35.0°C (3rd August 1990); lowest temperature 5.1°C (23rd August1993)
Lowest grass minimum temperature 1.0°C (23rd August1993)
Hottest August 1997 (Mean temperature 20.9°C); coolest August 1986 (Mean temperature 14.9°C)
Average August rainfall (30 years 1971/2000) 49.6 mm
Wettest August 1974 (Rainfall 109.0 mm); driest August 1995 (Rainfall 12.1 mm)
Wettest Day 31st August 1988 (Rainfall 45.3 mm);
Highest number of "rain days" (0.2 mm or more) 16 (1974, 1985 & 1992); lowest number of "rain days" 4 (1995)
Highest number of days with thunder 6 (1999)
|
|
|
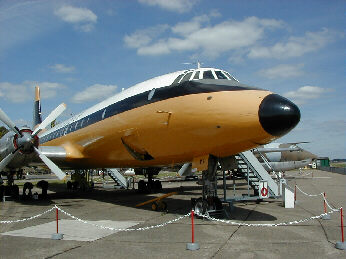
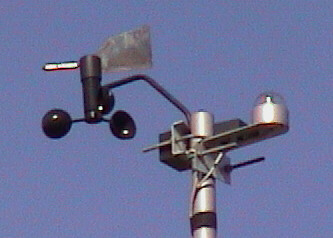
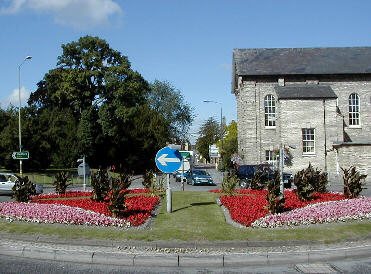
| One of the many historic aircraft on display at the Imperial War Museum, Duxford Airfield, some 10 km ENE of Royston (Iceni) Weather Station, as seen at 1346 GMT on 24th July 2001. The weather is ideal for viewing and photographing the outdoor exhibits, with a deep blue sky and various cirrus and cumulus cloud formations (plus aircraft contrails) providing some interesting backdrops, and a light westerly breeze. The day was one of a series of very sunny days with 12.5 hours sunshine being recorded (at Royston) by the end of the day. The 7 day period 23rd/29th witnessed a total of 79.4 hours sunshine. The maximum temperature (at Royston) on 24th was 23.5°C. | The mast mounted weather station wind vane and anemometer viewed from the ground at a distance on 28th August 2001, using 10 X optical zoom on the camera! Even at this zoom level, the image has required considerable further (digital) magnification. Electrical outputs from these instruments are transmitted by cable to a remote datalogger which is set to record the wind direction, the maximum gust speed and mean wind speed at 5 minute intervals. The metal cylinder capped by a glass dome which can be seen on the right hand side of the mast is the sunshine recorder, which similarly transmits electrical output to the datalogger. | The Town Hall roundabout in Royston is once again ablaze with colour, as seen in this view at 0859 GMT on 17th August 2001. The temperature is 18.4°C, after an overnight minimum of 11.0°C, whilst the wind direction is westerly and the mean wind speed 6 knots (occasionally gusting to 14 knots). A maximum temperature of 23.5°C was attained that day, and a total of 9.2 hours sunshine recorded. This picture depicts the view looking westwards along Melbourn Street towards Baldock, with the Town Hall prominent on the right. The main A10 trunk road crosses the roundabout from left (Hertford and London) to right (Cambridge and Kings Lynn). |
Return to Welcome to Royston (Iceni) Weather Station page
(This page last updated 11th September 2001 2021 GMT)