
Royston (Iceni) Weather Station
Daily Weather Observations - July 2001
| Date | Max | Min | Grass | Earth | Sunshine | Rainfall | Wind | Mean | Max | Cloud | Mean | Mean | Mean | Fog | Fog | Snow | Snow | Hail | Thunder | Date |
| Temp | Temp | Min | (30cm) | (Hrs) | (MM) | Direc- | Wind | Gust | Cover | MSL | Rel. | Temp | (vis.< | (vis.< | or | Lying | 00/00h | 00/00h | ||
| (°C) | (°C) | Temp | Temp | 00/00h | 09/09h | tion | Speed | Speed | (Oktas) | Pressure | Humd | (°C) | 1000m) | 200m | Rain/ | (>50% | ||||
| 09/09h | 09/09h | (°C) | (°C) | 09h | (mph) | (mph) | 09h | (mb) | (%) | 00/00h | 09h | 09h | Snow | cover | ||||||
| 09/09h | 09h | 00/00h | 00/00h | 00/00h | 00/00h | 00/00h | 09h) | |||||||||||||
| 1 | 24.0 | 13.4 | 12.0 | 18.9 | 2.50 | TR | W | 2.7 | 18 | 8 | 1025.9 | 73.4 | 18.7 | 0 | 0 | 0 | 0 | 0 | 0 | 1 |
| 2 | 26.8 | 17.4 | 14.5 | 19.0 | 4.82 | 0.0 | NE | 1.5 | 18 | 1 | 1025.8 | 69.3 | 21.8 | 0 | 0 | 0 | 0 | 0 | 0 | 2 |
| 3 | 25.6 | 16.0 | 15.0 | 19.7 | 13.80 | 0.0 | SE | 2.9 | 21 | 7 | 1016.4 | 69.8 | 20.7 | 0 | 0 | 0 | 0 | 0 | 0 | 3 |
| 4 | 28.5 | 16.5 | 14.2 | 20.0 | 15.48 | 0.0 | E | 1.1 | 18 | 0 | 1008.2 | 59.9 | 22.2 | 0 | 0 | 0 | 0 | 0 | 0 | 4 |
| 5 | 28.8 | 14.1 | 12.2 | 20.5 | 7.81 | 0.0 | NE | 0.8 | 16 | 6 | 1008.8 | 67.1 | 21.6 | 0 | 0 | 0 | 0 | 0 | 0 | 5 |
| 6 | 25.6 | 17.7 | 16.1 | 20.9 | 1.86 | TR | CALM | 1.2 | 14 | 8 | 1007.6 | 76.5 | 21.2 | 0 | 0 | 0 | 0 | 0 | 0 | 6 |
| 7 | 19.7 | 15.7 | 13.7 | 20.6 | 0.00 | 12.2 | N | 1.3 | 14 | 8 | 1004.7 | 93.7 | 17.7 | 1 | 0 | 0 | 0 | 0 | 0 | 7 |
| 8 | 20.5 | 16.0 | 15.5 | 19.6 | 0.38 | 0.0 | W | 4.3 | 21 | 8 | 1007.8 | 85.0 | 17.5 | 0 | 0 | 0 | 0 | 0 | 0 | 8 |
| 9 | 21.0 | 12.4 | 11.0 | 19.0 | 3.41 | 3.1 | SW | 5.0 | 21 | 4 | 1011.9 | 75.5 | 16.7 | 0 | 0 | 0 | 0 | 0 | 0 | 9 |
| 10 | 20.0 | 15.0 | 14.4 | 19.0 | 3.55 | 3.8 | SW | 8.9 | 35 | 7 | 1003.4 | 84.4 | 16.1 | 0 | 0 | 0 | 0 | 0 | 0 | 10 |
| 11 | 18.8 | 12.5 | 11.4 | 18.2 | 3.46 | 0.4 | SW | 11.6 | 51 | 7 | 1005.6 | 69.7 | 15.1 | 0 | 0 | 0 | 0 | 0 | 0 | 11 |
| 12 | 19.8 | 10.9 | 9.2 | 17.4 | 9.39 | 1.5 | SW | 8.5 | 35 | 5 | 1007.5 | 72.8 | 14.6 | 0 | 0 | 0 | 0 | 0 | 1 | 12 |
| 13 | 21.2 | 11.0 | 9.5 | 17.4 | 7.14 | 0.8 | SW | 5.7 | 25 | 6 | 1005.2 | 73.1 | 15.2 | 0 | 0 | 0 | 0 | 0 | 0 | 13 |
| 14 | 18.2 | 10.5 | 7.5 | 17.8 | 4.24 | 0.4 | N | 2.2 | 21 | 8 | 1005.9 | 78.6 | 12.9 | 0 | 0 | 0 | 0 | 0 | 0 | 14 |
| 15 | 19.8 | 8.6 | 5.7 | 17.5 | 9.67 | 0.0 | W | 2.5 | 21 | 1 | 1014.2 | 60.9 | 14.0 | 0 | 0 | 0 | 0 | 0 | 0 | 15 |
| 16 | 20.5 | 7.7 | 5.0 | 17.4 | 7.68 | 0.0 | NE | 0.8 | 18 | 0 | 1015.1 | 70.4 | 14.1 | 0 | 0 | 0 | 0 | 0 | 0 | 16 |
| 17 | 20.6 | 9.2 | 6.4 | 17.3 | 2.99 | 23.5 | SE | 2.2 | 25 | 4 | 1002.4 | 84.2 | 14.5 | 0 | 0 | 0 | 0 | 0 | 0 | 17 |
| 18 | 19.3 | 13.6 | 13.1 | 17.0 | 1.45 | 4.6 | SW | 1.7 | 21 | 8 | 994.3 | 88.1 | 15.4 | 0 | 0 | 0 | 0 | 0 | 0 | 18 |
| 19 | 17.6 | 12.2 | 12.1 | 17.4 | 0.37 | 5.2 | NW | 5.0 | 32 | 8 | 1004.5 | 91.9 | 13.4 | 0 | 0 | 0 | 0 | 0 | 0 | 19 |
| 20 | 20.5 | 10.0 | 8.5 | 16.9 | 6.45 | 3.8 | NW | 4.7 | 21 | 1 | 1013.8 | 73.1 | 15.0 | 0 | 0 | 0 | 0 | 0 | 0 | 20 |
| 21 | 20.9 | 11.5 | 11.1 | 17.7 | 1.40 | 0.0 | SW | 6.2 | 25 | 8 | 1012.1 | 80.0 | 17.2 | 0 | 0 | 0 | 0 | 0 | 0 | 21 |
| 22 | 21.1 | 14.1 | 12.9 | 17.9 | 1.34 | 0.0 | SW | 4.2 | 18 | 7 | 1015.9 | 81.0 | 17.5 | 0 | 0 | 0 | 0 | 0 | 0 | 22 |
| 23 | 25.5 | 13.8 | 10.9 | 18.0 | 11.81 | 0.0 | CALM | 1.5 | 16 | 3 | 1016.9 | 64.7 | 19.3 | 0 | 0 | 0 | 0 | 0 | 0 | 23 |
| 24 | 23.5 | 12.7 | 11.0 | 18.5 | 12.47 | 0.0 | NW | 2.2 | 16 | 2 | 1017.8 | 64.6 | 17.8 | 0 | 0 | 0 | 0 | 0 | 0 | 24 |
| 25 | 25.5 | 12.4 | 10.0 | 19.0 | 9.81 | 0.0 | S | 2.1 | 18 | 7 | 1018.7 | 71.3 | 18.7 | 0 | 0 | 0 | 0 | 0 | 0 | 25 |
| 26 | 27.4 | 13.5 | 11.5 | 19.3 | 12.91 | 0.0 | SE | 1.9 | 14 | 0 | 1017.0 | 66.8 | 20.0 | 0 | 0 | 0 | 0 | 0 | 0 | 26 |
| 27 | 28.0 | 15.5 | 12.5 | 19.6 | 12.73 | 0.0 | W | 1.4 | 14 | 3 | 1017.1 | 60.7 | 22.0 | 0 | 0 | 0 | 0 | 0 | 0 | 27 |
| 28 | 29.9 | 14.9 | 12.3 | 20.6 | 10.12 | 0.0 | N | 1.3 | 14 | 0 | 1020.9 | 60.2 | 22.4 | 0 | 0 | 0 | 0 | 0 | 0 | 28 |
| 29 | 30.9 | 19.4 | 18.0 | 21.0 | 9.54 | 0.0 | W | 4.8 | 23 | 6 | 1021.2 | 55.5 | 24.7 | 0 | 0 | 0 | 0 | 0 | 0 | 29 |
| 30 | 28.0 | 16.5 | 13.5 | 21.3 | 7.04 | 0.0 | W | 2.1 | 18 | 0 | 1021.6 | 65.2 | 22.2 | 0 | 0 | 0 | 0 | 0 | 0 | 30 |
| 31 | 24.8 | 16.1 | 15.0 | 21.4 | 4.84 | TR | NW | 3.3 | 18 | 8 | 1022.8 | 74.5 | 19.3 | 0 | 0 | 0 | 0 | 0 | 0 | 31 |
| Mean/Total | 23.3 | 13.6 | 11.8 | 18.9 | 200.46 | 59.3 | X | 3.4 | X | 4.8 | 1012.6 | 73.0 | 18.0 | 1 | 0 | 0 | 0 | 0 | 1 | Mean/Total |
| (+1.1) | (+1.1) | (108%) | (137%) |
Differences from average shown in red. Reference periods used - Temperature 25 years 1973/1997; Rainfall 35 years 1971/2000; Sunshine 30 years 1961/1990.
Note: In line with standard meteorological practice the 24 hour maximum temperature and rainfall are read at 0900 GMT and credited to the previous day e.g. data shown above for 1st actually read at 0900 GMT on 2nd and represents the previous 24 hours. The 24 hour minimum and grass minimum temperatures are similarly observed at 0900 GMT but are credited to the day of the reading (e.g. observations made at 0900 GMT on 2nd shown against 2nd and represent previous 24 hours). This is the reason why at daily update of the above table the minimum and grass minimum temperatures appear to be "ahead" of the other data mentioned. (This explanation given in response to a query received).
Click on the links below to view this month's graphs and charts....
1. Daily Maximum, Minimum, & Grass Minimum Temperatures
2. Daily Maximum & Minimum Temperatures (with 25 Year Comparative Means)
3. Daily Earth (30 cms Depth) Temperatures @ 0900 GMT 4. Daily Rainfall 5. Daily Sunshine
6. Daily Maximum Gust Speed & Mean Wind Speed 7. Daily Wind Direction @ 0900 GMT
8. Daily Mean MSL Air Pressure 9. Daily Mean Relative Humidity
10. Thermograph 11. Barograph 12. Hygrograph 13 Anemograph 14. Wind Direction
15. Sunshine Duration 16. Rainfall Intensity & Duration
.....and for a text report of the July 2001 weather in Royston click on the link below
July (since 1972) at Royston (Iceni) Weather Station:
Mean day maximum temperature (25 years 1973/1997) 22.2°C
Mean night minimum temperature (25 years 1973/1997) 12.5°C
Highest temperature 33.5°C (3rd July 1976); lowest temperature 6.4°C (30th July 1977)
Lowest grass minimum temperature 2.8°C (13th July 1993)
Hottest July 1983 (Mean temperature 20.3°C); coolest July 1978 (Mean temperature 15.2°C)
Average July rainfall (35 years 1971/2000) 43.2 mm
Wettest July 1987 (Rainfall 90.4 mm); driest July 1984 (Rainfall 8.3 mm)
Wettest Day 7th July 1989 (Rainfall 28.7 mm);
Highest number of "rain days" (0.2 mm or more) 20 (1988); lowest number of "rain days" 6 (1976,1977, 1979, 1984, & 1990)
Highest number of days with thunder 6 (1975, 1982, & 1983)
|
|
|
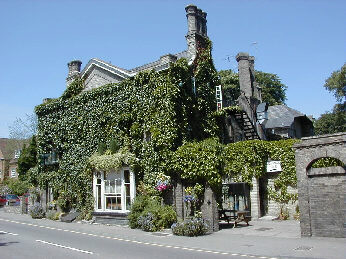
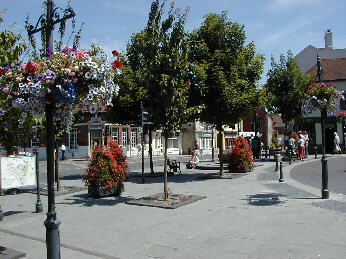
| The photographs accompanying this month's data depict views in downtown Royston as seen in the late morning of 4th July 2001. The first picture (at 1119 GMT) shows the distinctive landmark of the Banyers Hotel in Melbourn Street, a street relieved of heavy traffic when the A505 Royston by-pass was opened in 1982. The second view (1123 GMT), at the Cross, also shows Melbourn Street beyond the paved area at the northern end of the High Street, a short distance to the west of the first location. >>>>>>>>> | The third photograph (1137 GMT) shows a northward looking view across the Market area during the Wednesday market. The relatively tall building in the centre background is the Royston Library. As is apparent in the pictures this was a glorious Summer day with bright sunshine commencing at 0410 GMT and continuing almost unbroken until 1955 GMT. The sunshine total of 15.5 hours for the day proved to be the highest daily total for the whole month. >>>>>>>>>> | The temperature at the time the photographs were taken was 27°C, and later reached the maximum for the day of 28.5°C. This was after an overnight minimum temperature of 16.5°C, this high minimum contributing to the high mean temperature for the 24 hours (midnight to midnight) of 22.2°C (as calculated from continuous 5 minute observations). The wind direction in the late morning was variable, registering a mean speed of only 1 knot, with the occasional gust to 12 knots. |
Return to Welcome to Royston (Iceni) Weather Station page
(This page last updated 13th August 2001 2027 GMT)