Royston (Iceni) Weather Station
Daily Weather Observations - July 2000
| Date | Max | Min | Grass | Earth | Sunshine | Rainfall | Wind | Mean | Max | Cloud | Mean | Mean | Mean | Fog | Fog | Snow | Snow | Hail | Thunder | Date |
| Temp | Temp | Min | (30cm) | (Hrs) | (MM) | Direc- | Wind | Gust | Cover | MSL | Rel. | Temp | (vis.< | (vis.< | or | Lying | 00/00h | 00/00h | ||
| (°C) | (°C) | Temp | Temp | 00/00h | 09/09h | tion | Speed | Speed | (Oktas) | Pressure | Humd | (°C) | 1000m) | 200m | Rain/ | (>50% | ||||
| 09/09h | 09/09h | (°C) | (°C) | 09h | (mph) | (mph) | 09h | (mb) | (%) | 00/00h | 09h | 09h | Snow | cover | ||||||
| 09/09h | 09h | 00/00h | 00/00h | 00/00h | 00/00h | 00/00h | 09h) | |||||||||||||
| 1 | 20.5 | 11.6 | 10.9 | 17.1 | 0.77 | 2.7 | S | 1.3 | 14 | 8 | 1008.5 | 86.7 | 15.9 | 0 | 0 | 0 | 0 | 0 | 0 | 1 |
| 2 | 21.5 | 13.1 | 11.5 | 17.4 | 4.93 | 14.8 | N | 1.5 | 16 | 6 | 1008.9 | 80.1 | 17.5 | 0 | 0 | 0 | 0 | 0 | 0 | 2 |
| 3 | 22.5 | 13.7 | 12.7 | 18.0 | 1.50 | 18.9 | NW | 0.4 | 14 | 7 | 1008.4 | 87.1 | 16.8 | 0 | 0 | 0 | 0 | 0 | 1 | 3 |
| 4 | 16.2 | 13.1 | 12.4 | 18.4 | 0.00 | 12.5 | NE | 0.8 | 14 | 8 | 1006.8 | 95.5 | 14.5 | 0 | 0 | 0 | 0 | 0 | 0 | 4 |
| 5 | 16.3 | 13.0 | 12.9 | 17.7 | 0.00 | 0.5 | NE | 0.6 | 12 | 8 | 1012.7 | 94.0 | 14.1 | 0 | 0 | 0 | 0 | 0 | 0 | 5 |
| 6 | 20.1 | 12.2 | 11.0 | 17.3 | 3.34 | 0.1 | S | 1.6 | 16 | 8 | 1018.0 | 87.3 | 15.9 | 0 | 0 | 0 | 0 | 0 | 1 | 6 |
| 7 | 17.0 | 12.1 | 11.6 | 17.5 | 5.54 | 0.3 | NE | 3.0 | 21 | 8 | 1018.4 | 78.0 | 13.8 | 0 | 0 | 0 | 0 | 0 | 0 | 7 |
| 8 | 17.8 | 10.2 | 7.9 | 17.0 | 0.41 | 4.3 | W | 4.5 | 23 | 8 | 1014.8 | 82.4 | 13.6 | 0 | 0 | 0 | 0 | 0 | 0 | 8 |
| 9 | 19.3 | 12.4 | 11.9 | 17.1 | 2.14 | 4.3 | SW | 6.2 | 30 | 8 | 995.9 | 87.7 | 14.9 | 0 | 0 | 0 | 0 | 0 | 0 | 9 |
| 10 | 14.5 | 11.4 | 10.0 | 17.4 | 0.84 | 11.9 | W | 6.7 | 30 | 8 | 991.6 | 92.3 | 12.0 | 0 | 0 | 0 | 0 | 0 | 0 | 10 |
| 11 | 15.9 | 9.2 | 8.7 | 16.4 | 2.73 | TR | NW | 3.5 | 30 | 8 | 1005.9 | 71.6 | 11.4 | 0 | 0 | 0 | 0 | 0 | 0 | 11 |
| 12 | 18.9 | 8.3 | 6.5 | 15.8 | 4.52 | 1.4 | W | 4.6 | 23 | 8 | 1013.1 | 72.8 | 14.1 | 0 | 0 | 0 | 0 | 0 | 0 | 12 |
| 13 | 19.5 | 12.9 | 11.7 | 16.5 | 1.91 | 0.5 | W | 5.1 | 28 | 8 | 1009.7 | 82.6 | 15.3 | 0 | 0 | 0 | 0 | 0 | 0 | 13 |
| 14 | 15.5 | 11.6 | 10.9 | 16.9 | 1.00 | 0.1 | NW | 6.0 | 28 | 8 | 1010.2 | 78.5 | 13.6 | 0 | 0 | 0 | 0 | 0 | 0 | 14 |
| 15 | 16.5 | 9.1 | 7.5 | 16.5 | 1.75 | TR | N | 3.2 | 23 | 8 | 1015.5 | 80.6 | 12.1 | 0 | 0 | 0 | 0 | 0 | 0 | 15 |
| 16 | 16.1 | 8.3 | 5.7 | 16.1 | 3.48 | 0.0 | N | 1.9 | 18 | 8 | 1019.1 | 70.4 | 11.9 | 0 | 0 | 0 | 0 | 0 | 0 | 16 |
| 17 | 21.0 | 8.5 | 5.9 | 16.2 | 11.13 | 0.0 | N | 0.9 | 12 | 5 | 1019.8 | 72.7 | 14.9 | 0 | 0 | 0 | 0 | 0 | 0 | 17 |
| 18 | 23.8 | 9.1 | 6.5 | 17.0 | 14.47 | 0.0 | N | 1.3 | 18 | 0 | 1020.4 | 69.1 | 16.6 | 0 | 0 | 0 | 0 | 0 | 0 | 18 |
| 19 | 24.4 | 10.4 | 7.6 | 18.0 | 11.82 | 0.0 | W | 2.8 | 21 | 0 | 1020.4 | 65.1 | 17.8 | 0 | 0 | 0 | 0 | 0 | 0 | 19 |
| 20 | 25.0 | 12.4 | 9.1 | 18.5 | 11.65 | 0.0 | NW | 1.2 | 12 | 0 | 1022.6 | 65.9 | 18.5 | 0 | 0 | 0 | 0 | 0 | 0 | 20 |
| 21 | 24.0 | 11.9 | 9.0 | 18.9 | 13.56 | 0.0 | NE | 1.5 | 16 | 0 | 1025.0 | 72.3 | 17.9 | 0 | 0 | 0 | 0 | 0 | 0 | 21 |
| 22 | 19.0 | 12.0 | 9.6 | 19.0 | 0.79 | 0.1 | NE | 3.3 | 18 | 8 | 1022.3 | 81.8 | 14.5 | 0 | 0 | 0 | 0 | 0 | 0 | 22 |
| 23 | 18.1 | 11.8 | 11.6 | 18.5 | 0.12 | 0.6 | NE | 2.9 | 16 | 8 | 1016.3 | 88.7 | 14.2 | 0 | 0 | 0 | 0 | 0 | 0 | 23 |
| 24 | 15.4 | 11.6 | 11.7 | 18.0 | 0.01 | TR | NE | 2.7 | 21 | 8 | 1009.8 | 92.0 | 12.8 | 0 | 0 | 0 | 0 | 0 | 0 | 24 |
| 25 | 19.0 | 11.5 | 10.1 | 17.4 | 0.12 | 0.0 | N | 0.4 | 9 | 8 | 1007.6 | 78.6 | 14.8 | 0 | 0 | 0 | 0 | 0 | 0 | 25 |
| 26 | 22.3 | 12.7 | 11.6 | 17.6 | 5.63 | 0.0 | N | 1.0 | 14 | 7 | 1009.3 | 69.8 | 17.5 | 0 | 0 | 0 | 0 | 0 | 0 | 26 |
| 27 | 24.7 | 14.6 | 12.5 | 17.9 | 8.37 | TR | S | 3.2 | 18 | 4 | 1011.4 | 64.3 | 19.5 | 0 | 0 | 0 | 0 | 0 | 0 | 27 |
| 28 | 23.0 | 13.7 | 12.4 | 18.5 | 8.93 | 1.3 | W | 4.5 | 18 | 4 | 1012.4 | 75.6 | 18.2 | 0 | 0 | 0 | 0 | 0 | 1 | 28 |
| 29 | 24.5 | 13.9 | 12.6 | 18.7 | 4.60 | TR | W | 2.8 | 21 | 7 | 1016.0 | 71.9 | 18.3 | 0 | 0 | 0 | 0 | 0 | 0 | 29 |
| 30 | 25.0 | 13.7 | 12.1 | 18.9 | 9.01 | 0.0 | NW | 2.6 | 16 | 3 | 1021.0 | 67.6 | 19.5 | 0 | 0 | 0 | 0 | 0 | 0 | 30 |
| 31 | 25.0 | 14.6 | 12.5 | 19.1 | 8.57 | TR | SW | 4.0 | 21 | 5 | 1020.3 | 64.7 | 20.3 | 0 | 0 | 0 | 0 | 0 | 0 | 31 |
| Mean/Total | 20.1 | 11.8 | 10.3 | 17.6 | 143.64 | 74.3 | X | 2.8 | X | 6.2 | 1013.3 | 78.3 | 15.6 | 0 | 0 | 0 | 0 | 0 | 3 | Mean/Total |
| (-2.1) | (-0.7) | (77%) | (153%) |
Differences from average shown in red. Reference periods used - Temperature 25 years 1973/1997; Rainfall 35 years 1961/1995; Sunshine 30 years 1961/1990.
Note: In line with standard meteorological practice the 24 hour maximum temperature and rainfall are read at 0900 GMT and credited to the previous day e.g. data shown above for 1st actually read at 0900 GMT on 2nd and represents the previous 24 hours. The 24 hour minimum and grass minimum temperatures are similarly observed at 0900 GMT but are credited to the day of the reading (e.g. observations made at 0900 GMT on 2nd shown against 2nd and represent previous 24 hours). This is the reason why at daily update of the above table the minimum and grass minimum temperatures appear to be "ahead" of the other data mentioned. (This explanation given in response to a query received).
To view this month's graphs and charts click on the links below......
1. Maximum, Minimum, and Grass Minimum Temperatures
2. Maximum & Minimum Temperatures (with 25 Year Comparative Means)
3. Earth (30 cms Depth) Temperature 4. Rainfall 5. Sunshine
6. Wind Speed 7. Wind Direction @ 0900 GMT 8. Mean Sea-Level Air Pressure
9. Relative Humidity 10. Thermograph 11. Barograph 12. Hygrograph
13. Anemograph 14. Wind Direction (Graph) 15. Sunshine Duration 16. Hyetograph
......and for a text report of the July weather click on the link below
July (since 1972) at Royston (Iceni) Weather Station:
Mean day maximum temperature (25 years 1973/1997) 22.2°C
Mean night minimum temperature (25 years 1973/1997) 12.5°C
Highest temperature 33.5°C (3rd July 1976); lowest temperature 6.4°C (30th July 1977)
Lowest grass minimum temperature 2.8°C (13th July 1993)
Hottest July 1983 (Mean temperature 20.3°C); coolest July 1978 (Mean temperature 15.2°C)
Average July rainfall (35 years 1961/1995) 48.7 mm
Wettest July 1987 (Rainfall 90.4 mm); driest July 1984 (Rainfall 8.3 mm)
Wettest Day 7th July 1989 (Rainfall 28.7 mm);
Highest number of "rain days" (0.2 mm or more) 20 (1988); lowest number of "rain days" 6 (1976,1977, 1979, 1984, & 1990)
Highest number of days with thunder 6 (1975, 1982, & 1983)
|
|
|
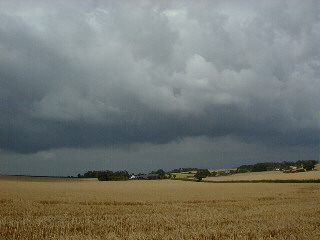
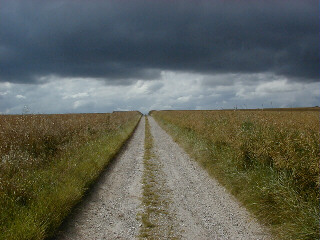
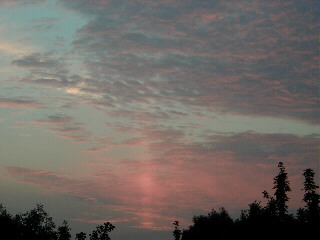
| A scene typical of the Royston area with acres of barley rolling across the landscape. This photograph was taken near to Heath Farm (just visible at centre) about 2 km SE of Royston on 12th July 2000 at 0847 GMT. Despite the threatening sky it was actually sunny at Royston (Iceni) Weather Station (1.5 km distant) at this time and no rainfall was recorded here. The temperature was 16°C with a westerly wind of mean speed 5 knots, gusting to 12 knots. A cool day followed with a maximum temperature of only 18.9°C, which is 3.0°C below normal. Sunshine for the day was 4.5 hours. The cluster of buildings visible to the right of the picture are at Eagle Tavern on the Barkway Road. | A picture reminiscent of the American mid-west as depicted in the movies is actually some 3 km SE of Royston as seen on 15th July 2000 at 0945 GMT. Here weak sunshine filters through on to fields of ripening oil seed rape under dark cloud encroaching from the north-west (the picture is looking due south), which despite its ominous appearance did not produce any rain. The temperature was 15°C, not far from its maximum for the day of 16.5°C which is very low for July, being 5.5°C below normal! The mean wind speed is 4 knots, gusting to 16 knots. Sunshine for the day was only 1.8 hours which unbelievably was not far from the daily average for the very dull first half of July this year! | With reference to the weather described in relation to the previous two pictures, a vast improvement in the July 2000 weather occurred on 17th, and on the day (18th) the above photograph was taken the maximum temperature attained a more respectable value of 23.8°C and sunshine of 14.5 hours was recorded. This photograph which appears to show a mock sun was taken at 2021 GMT which was actually a few minutes after sunset. A characteristic of this sunset was the purple tinge evident on the visible cloud. This was obviously a good omen for the next day which produced a maximum temperature of 24.4°C, and sunshine of 11.8 hours. |
Return to Welcome to Royston (Iceni) Weather Station page
(This page last updated 10th August 2000 2031 GMT)