Royston (Iceni) Weather Station
Daily Weather Observations - March 2000
| Date | Max | Min | Grass | Earth | Sunshine | Rainfall | Wind | Mean | Max | Cloud | Mean | Mean | Mean | Fog | Fog | Snow | Snow | Hail | Thunder | Date |
| Temp | Temp | Min | (30cm) | (Hrs) | (MM) | Direc- | Wind | Gust | Cover | MSL | Rel. | Temp | (vis.< | (vis.< | or | Lying | 00/00h | 00/00h | ||
| (°C) | (°C) | Temp | Temp | 00/00h | 09/09h | tion | Speed | Speed | (Oktas) | Pressure | Humd | (°C) | 1000m) | 200m | Rain/ | (>50% | ||||
| 09/09h | 09/09h | (°C) | (°C) | 09h | (mph) | (mph) | 09h | (mb) | (%) | 00/00h | 09h | 09h | Snow | cover | ||||||
| 09/09h | 09h | 00/00h | 00/00h | 00/00h | 00/00h | 00/00h | 09h) | |||||||||||||
| 1 | 8.6 | 2.2 | -0.1 | 6.1 | 2.67 | 0.3 | NW | 6.1 | 25 | 7 | 1009.3 | 83.0 | 3.9 | 0 | 0 | 0 | 0 | 0 | 0 | 1 |
| 2 | 10.6 | 1.3 | -2.0 | 5.5 | 0.00 | 4.3 | SW | 12.3 | 48 | 8 | 1013.9 | 84.8 | 6.1 | 0 | 0 | 0 | 0 | 0 | 0 | 2 |
| 3 | 10.0 | 4.5 | 2.4 | 6.2 | 6.03 | 0.0 | NW | 9.4 | 58 | 0 | 1006.1 | 76.1 | 6.6 | 0 | 0 | 0 | 0 | 0 | 0 | 3 |
| 4 | 7.6 | -2.0 | -5.6 | 5.8 | 9.03 | 0.0 | W | 4.8 | 28 | 1 | 1026.3 | 70.2 | 2.2 | 0 | 0 | 0 | 0 | 0 | 0 | 4 |
| 5 | 9.6 | 1.2 | -2.0 | 5.0 | 5.89 | 0.0 | W | 5.3 | 21 | 6 | 1031.2 | 74.7 | 4.8 | 0 | 0 | 0 | 0 | 0 | 0 | 5 |
| 6 | 11.4 | 4.5 | 3.5 | 5.5 | 0.70 | 0.0 | SW | 9.5 | 32 | 7 | 1025.0 | 85.6 | 8.2 | 0 | 0 | 0 | 0 | 0 | 0 | 6 |
| 7 | 13.6 | 7.9 | 5.8 | 6.2 | 2.47 | TR | SW | 11.8 | 44 | 7 | 1021.6 | 85.7 | 10.5 | 0 | 0 | 0 | 0 | 0 | 0 | 7 |
| 8 | 16.5 | 10.5 | 9.0 | 7.2 | 1.29 | 0.0 | SW | 13.4 | 41 | 8 | 1019.9 | 85.8 | 12.2 | 0 | 0 | 0 | 0 | 0 | 0 | 8 |
| 9 | 15.9 | 10.5 | 8.3 | 8.1 | 3.94 | 0.1 | W | 9.2 | 39 | 7 | 1023.9 | 76.8 | 11.9 | 0 | 0 | 0 | 0 | 0 | 0 | 9 |
| 10 | 12.1 | 8.9 | 5.6 | 8.6 | 0.43 | 0.3 | W | 4.7 | 25 | 8 | 1024.9 | 84.2 | 9.9 | 0 | 0 | 0 | 0 | 0 | 0 | 10 |
| 11 | 13.0 | 7.6 | 5.5 | 8.7 | 5.01 | 0.0 | NW | 6.1 | 30 | 4 | 1021.7 | 75.1 | 9.1 | 0 | 0 | 0 | 0 | 0 | 0 | 11 |
| 12 | 14.0 | 3.5 | -0.5 | 8.4 | 11.02 | 0.0 | W | 3.4 | 18 | 1 | 1025.7 | 78.5 | 7.9 | 0 | 0 | 0 | 0 | 0 | 0 | 12 |
| 13 | 14.8 | 6.5 | 2.5 | 8.3 | 3.05 | TR | NW | 5.7 | 23 | 5 | 1025.2 | 82.8 | 10.5 | 0 | 0 | 0 | 0 | 0 | 0 | 13 |
| 14 | 11.5 | 8.2 | 6.6 | 8.8 | 2.10 | TR | W | 9.0 | 39 | 7 | 1023.8 | 77.2 | 8.3 | 0 | 0 | 0 | 0 | 0 | 0 | 14 |
| 15 | 12.5 | 0.8 | -2.4 | 8.1 | 10.36 | 0.0 | W | 5.6 | 28 | 1 | 1033.6 | 74.7 | 6.5 | 0 | 0 | 0 | 0 | 0 | 0 | 15 |
| 16 | 11.9 | 4.6 | 1.0 | 8.4 | 0.13 | 0.0 | W | 3.5 | 21 | 8 | 1034.3 | 80.6 | 7.9 | 0 | 0 | 0 | 0 | 0 | 0 | 16 |
| 17 | 10.2 | 6.0 | 1.5 | 8.5 | 0.00 | 0.1 | NW | 2.6 | 14 | 8 | 1034.2 | 78.4 | 8.1 | 0 | 0 | 0 | 0 | 0 | 0 | 17 |
| 18 | 11.2 | 5.8 | 4.7 | 8.5 | 3.92 | 0.0 | N | 3.8 | 25 | 7 | 1036.3 | 77.3 | 6.5 | 0 | 0 | 0 | 0 | 0 | 0 | 18 |
| 19 | 12.5 | 0.1 | -4.1 | 8.2 | 7.74 | 0.0 | N | 0.8 | 12 | 8 | 1036.5 | 80.2 | 5.4 | 0 | 0 | 0 | 0 | 0 | 0 | 19 |
| 20 | 12.5 | 3.5 | -1.4 | 8.2 | 0.00 | 0.0 | NW | 0.8 | 9 | 8 | 1030.1 | 85.1 | 7.7 | 0 | 0 | 0 | 0 | 0 | 0 | 20 |
| 21 | 13.5 | 6.0 | 3.5 | 8.5 | 10.37 | 0.0 | S | 2.4 | 18 | 1 | 1022.2 | 78.3 | 8.5 | 0 | 0 | 0 | 0 | 0 | 0 | 21 |
| 22 | 12.6 | 2.4 | 1.0 | 8.7 | 4.42 | 0.0 | CALM | 0.9 | 14 | 8 | 1016.8 | 84.6 | 7.0 | 1 | 0 | 0 | 0 | 0 | 0 | 22 |
| 23 | 13.5 | 5.3 | 1.5 | 8.7 | 1.32 | 1.8 | SE | 2.9 | 25 | 4 | 1010.8 | 77.1 | 8.4 | 0 | 0 | 0 | 0 | 0 | 0 | 23 |
| 24 | 13.5 | 7.9 | 7.0 | 9.0 | 6.37 | 0.0 | SW | 4.1 | 25 | 4 | 1006.1 | 82.7 | 9.3 | 0 | 0 | 0 | 0 | 0 | 0 | 24 |
| 25 | 11.9 | 4.1 | 2.2 | 9.0 | 7.31 | 1.1 | SW | 4.9 | 23 | 2 | 1009.1 | 83.5 | 6.6 | 0 | 0 | 0 | 0 | 0 | 0 | 25 |
| 26 | 11.5 | 1.4 | -0.6 | 8.5 | 8.46 | 2.4 | SW | 2.3 | 16 | 6 | 1007.7 | 79.8 | 5.4 | 0 | 0 | 0 | 0 | 0 | 0 | 26 |
| 27 | 10.5 | 2.5 | 0.5 | 8.5 | 2.09 | 0.3 | N | 5.1 | 30 | 7 | 1015.5 | 86.6 | 5.1 | 0 | 0 | 0 | 0 | 0 | 0 | 27 |
| 28 | 7.6 | 3.4 | 2.0 | 8.5 | 0.06 | 0.4 | NE | 6.5 | 28 | 8 | 1022.2 | 83.0 | 4.2 | 0 | 0 | 0 | 0 | 0 | 0 | 28 |
| 29 | 6.5 | 3.6 | 3.3 | 8.1 | 0.00 | TR | NE | 7.2 | 30 | 8 | 1019.1 | 91.6 | 4.8 | 0 | 0 | 0 | 0 | 0 | 0 | 29 |
| 30 | 7.6 | 4.6 | 4.4 | 7.9 | 0.00 | 0.0 | N | 3.4 | 18 | 8 | 1015.1 | 88.5 | 5.4 | 0 | 0 | 0 | 0 | 0 | 0 | 30 |
| 31 | 11.1 | 2.6 | 1.9 | 7.9 | 4.21 | 0.2 | N | 0.6 | 12 | 3 | 1007.0 | 77.7 | 5.8 | 0 | 0 | 0 | 0 | 0 | 0 | 31 |
| Mean/ | 11.6 | 4.5 | 2.1 | 7.8 | 120.39 | 11.3 | X | 5.4 | X | 5.6 | 1021.1 | 81.0 | 7.2 | 1 | 0 | 0 | 0 | 0 | 0 | Mean/ |
| Total | (+1.7) | (+1.4) | (111%) | (26%) | Total |
(Differences from average in red - Temperature 25 Years 1973/1997, rainfall 35 Years 1961/1995, sunshine 30 Years 1961/1990)
Additional Data: Rainfall duration 19.4 hours; air frost duration 7.3 hours.
Click on the links below to access this month's graphs and charts.....
1. Daily Maximum, Minimum, & Grass Minimum Temperatures
2. Daily Maximum & Minimum Temperatures (with 25 Year Comparative Means)
3. Daily Earth (30 cms depth) Temperature 4. Daily Rainfall 5. Daily Sunshine
6. Wind Speed 7. Daily Mean MSL Air Pressure 8. Daily Mean Relative Humidity
9. Thermograph 10. Barograph 11. Hygrograph 12. Anemograph 13. Wind Direction
14. Daily Wind Direction (@ 0900 GMT) 15. Hyetograph
....... and for a written report of the March 2000 Weather click below
|
|
|
|
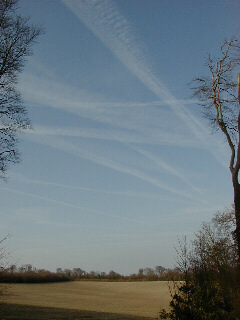
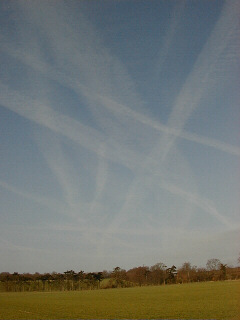
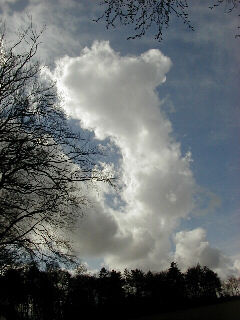
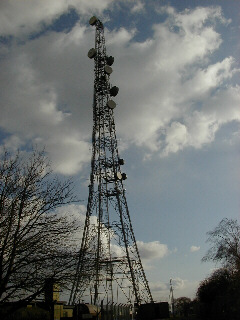
| Aircraft contrails fill the sky over Royston on 21st March 2000 (photograph taken at 0818 GMT looking SSW from Burloes). The temperature is 9°C, with a light 2 knot breeze from the SSE, gusting to 6 knots. | As in the first picture, the impression is given of a lot of aircraft activity over the Royston area on 21st March 2000. This photograph was taken from a point some 2.5 km east of Royston looking westwards at 0829 GMT. | Rapidly growing cumulus clouds in the morning (with this one showing signs of vigorous vertical development) give an indication of showers to come later (and they did!). This photograph was taken at 1004 GMT on 25th March 2000 from the Burloes Estate looking SW. A SSW wind of strength 6 knots (gusting to 14 knots) is blowing, and the temperature is 10.2°C. | The communications mast at RAF Barkway is a familiar landmark in the Royston area as it stands at some 160 metres above sea-level on the crest of the East Anglian Heights about 6 km to the south of the town. Although the temperature is 7°C at Royston (Iceni) Weather Station about 80 metres below this point, it is obviously not as high at the mast as a snow shower occurred just before this picture was taken at 1535 GMT. |
Return to Welcome to Royston (Iceni) Weather Station page
(This page last updated 29th April 2000 2049 GMT)